
Agent Performance Dashboard
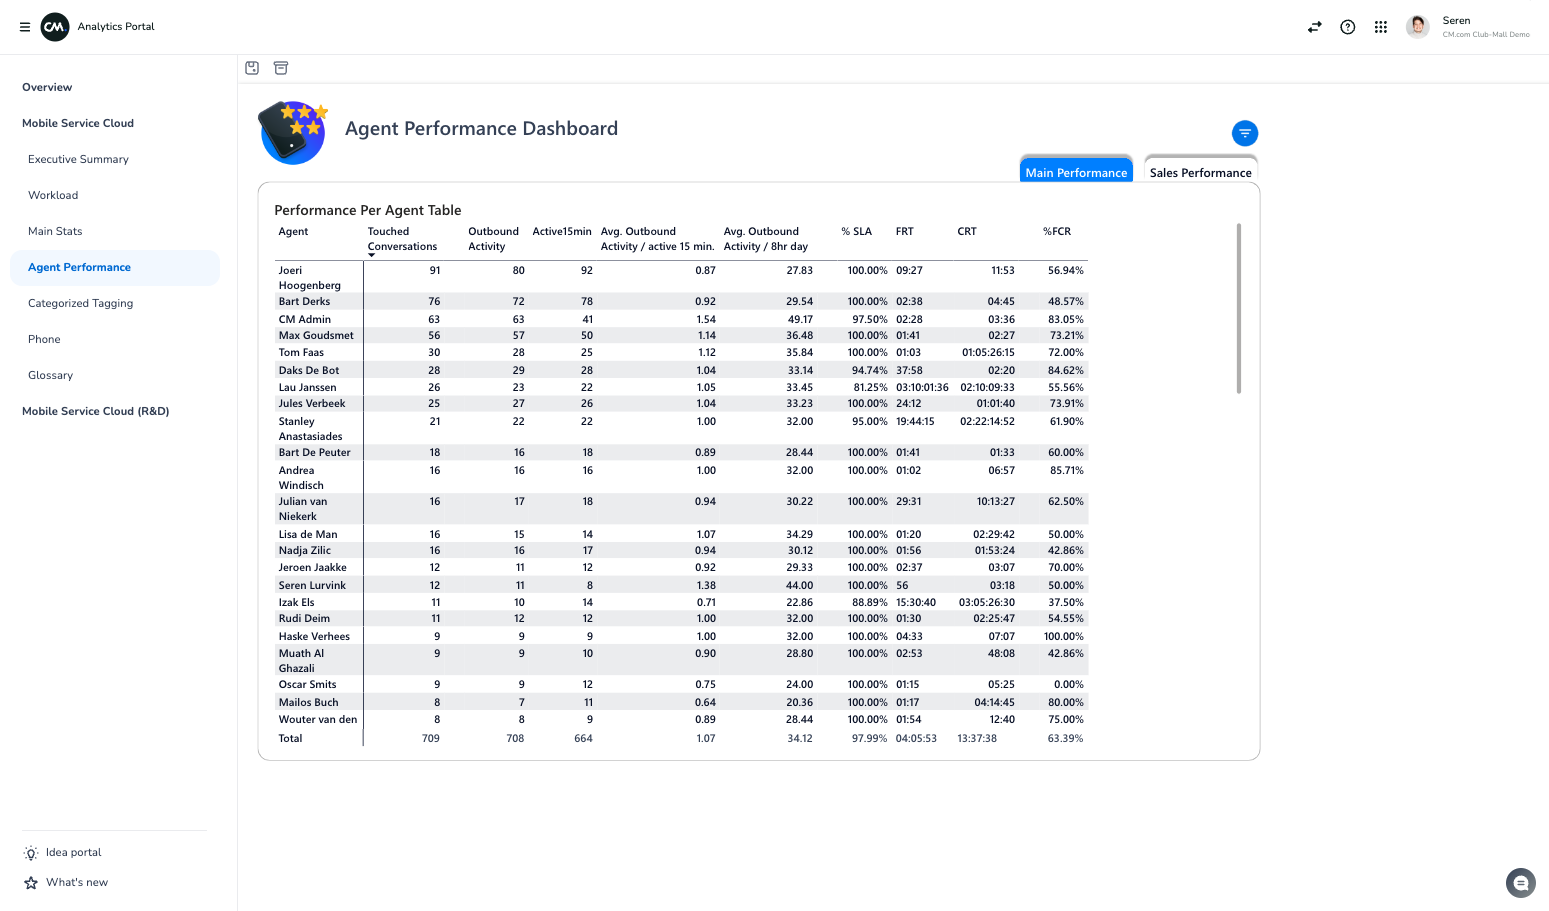
The Agent Dashboard provides a comprehensive overview of key operational and sales performance indicators for agents, all in a single, easy-to-read table. This table offers a high-level snapshot across various metrics. For detailed analysis, a trend evolution widget below allows you to explore the historical performance of each indicator. By clicking on metrics of interest, you can quickly drill down into specific data points for a deeper understanding of trends and patterns over time. This combined view of current stats and historical trends aids in making informed, data-driven decisions and optimizing agent performance.
Instruction Video
Please watch this instructional video on the Agent Dashboard.