Dialog Analytics tool (beta)
This dialog analytics tool offers an overview of all interactions including the entries and dropouts, within the selected timeframe. Hover over the '?' icon to view explanations of dropouts and the interaction flowchart.
Time range: 2 months
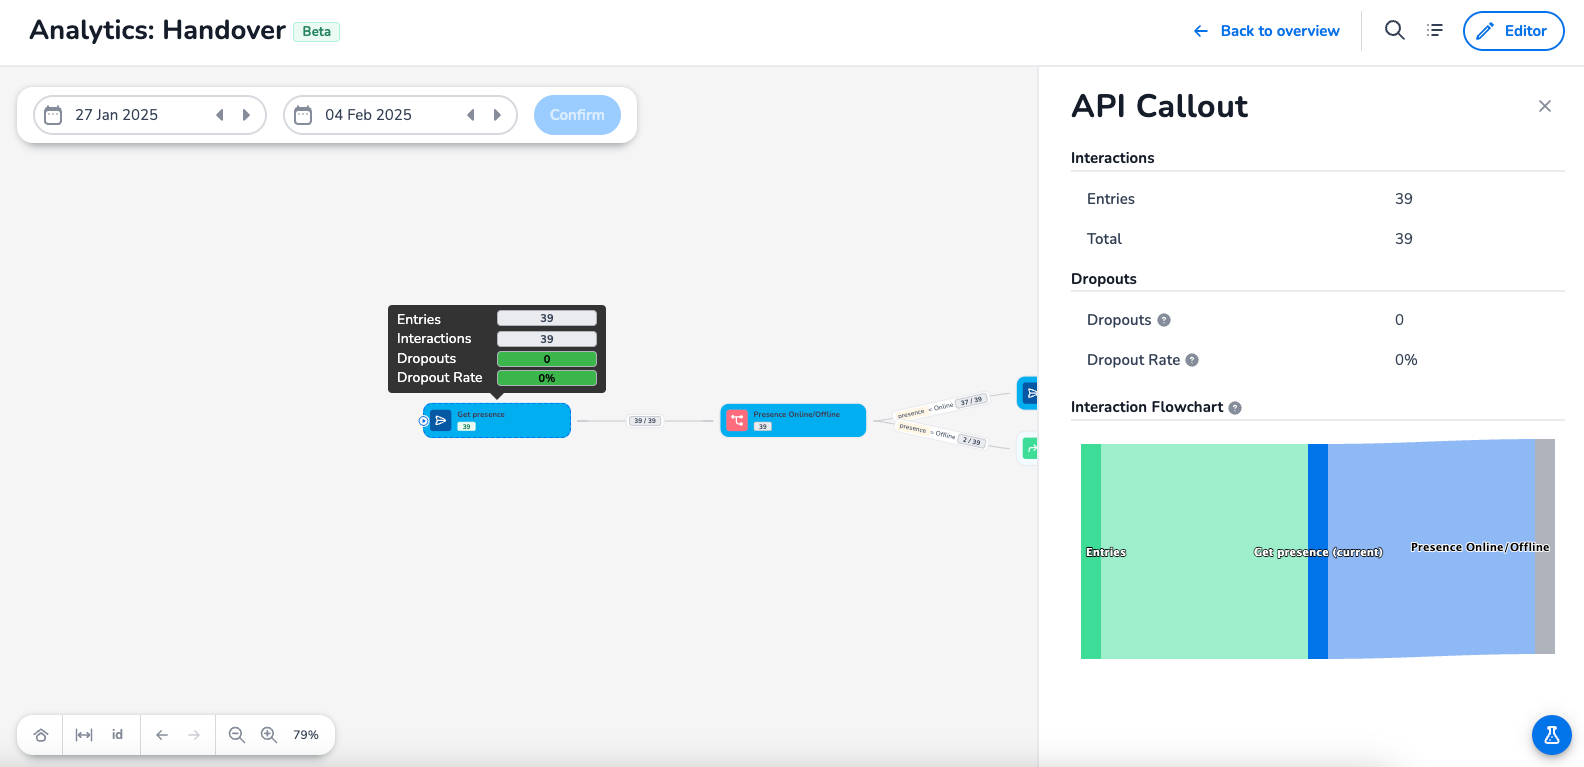
Dropouts: The amount of interactions that did not continue the dialog from this node
Dropout Rate: % of interactions that dropped out compared to the total interactions
Interaction Flowchart: Shows the interaction flow from and to the current node
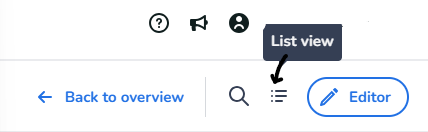
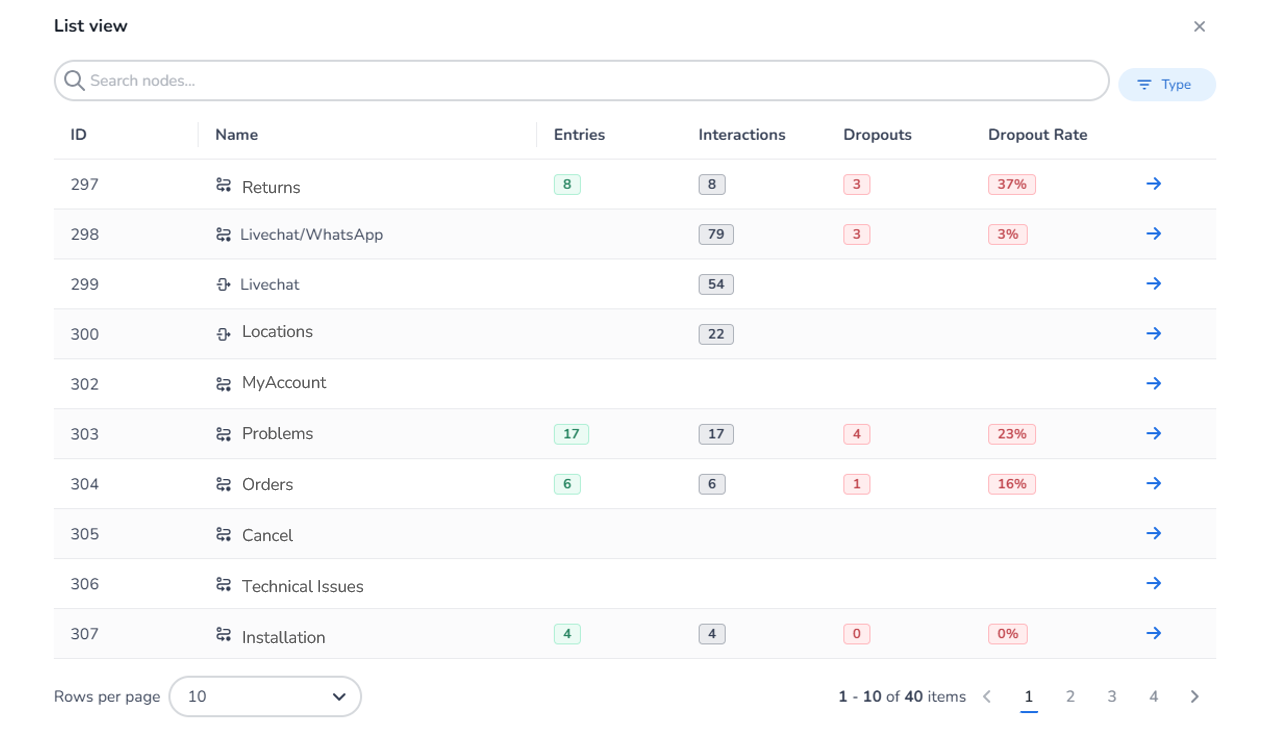
List View
A list view is also available. To access this view, click the 'List view' icon at the top of the screen.
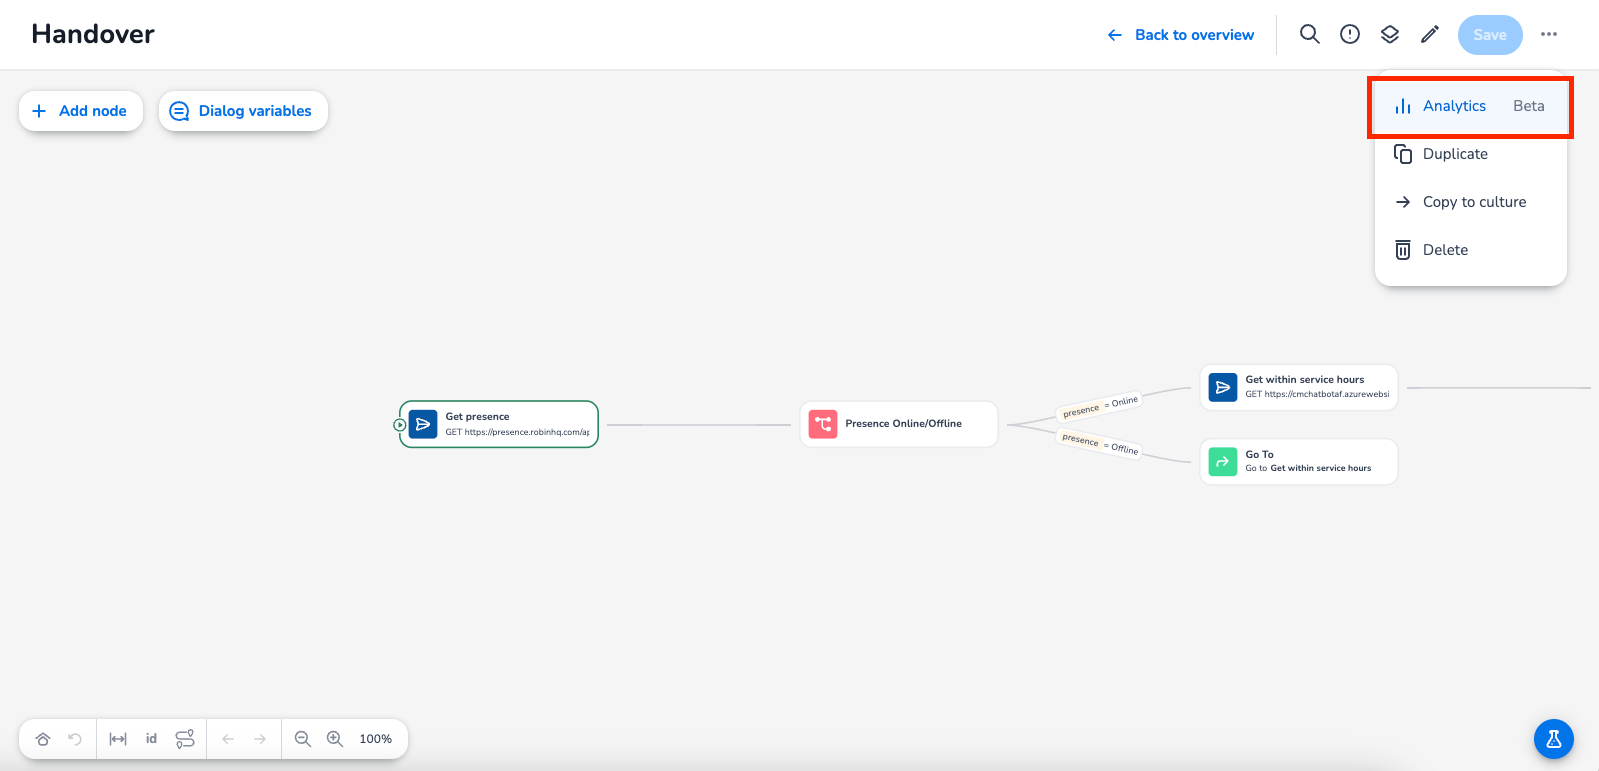
Via the Dialogs Editor
You can also access the Dialog Analytics via the Dialog editor by clicking on the three dots in the upper-right corner: