Events Dashboard
This dashboard is all about events. The default dashboard filters apply, but this dashboard is limited to show interactions through events only.
Positive Feedback Widget
This widget shows the overall % of feedback on events that was positive. If this is low, you should review the various event answers that received negative feedback to improve their effectiveness.
Note: Feedback is often disabled for events. If so, this widget may give a n/a value.
Interaction Link Click % Widget
Overall % of offered links that your users clicked. If this percentage is low, you are either offering links that your users don’t need or it is not clear enough from your answers that these links are useful. Consider emphasizing the purpose of the link in your answer with a Call to Action.
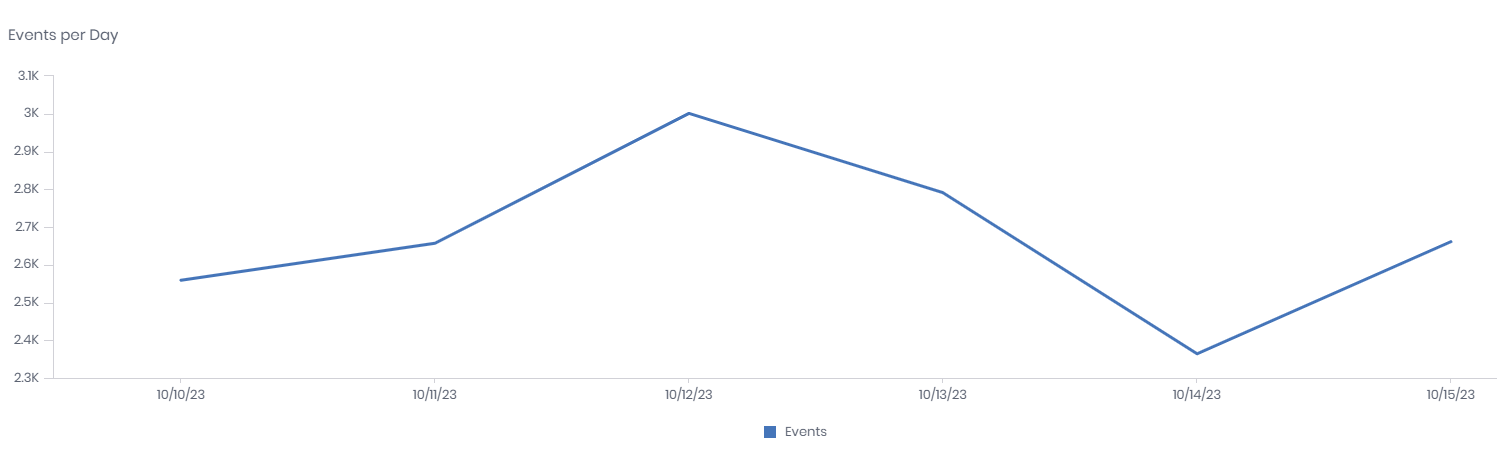
Events per Day Widget
Line chart showing the number of Event activations.
Top Events Widget
Shows how often each event is activated by name, and how much Positive/Negative feedback and link clicks the event received. This widget can be used to filter the dashboard.
3f43ad4d-50f2-4757-a01e-14ce8620d713-blobContexts Widget
Shows how often events are activated for a specific context. Depending on the setting for that particular context, this value may only be logged if it makes a difference for the event answer.
da034422-3817-4b6b-acc4-6682b5022a09-blobThis widget can be used to filter the dashboard.
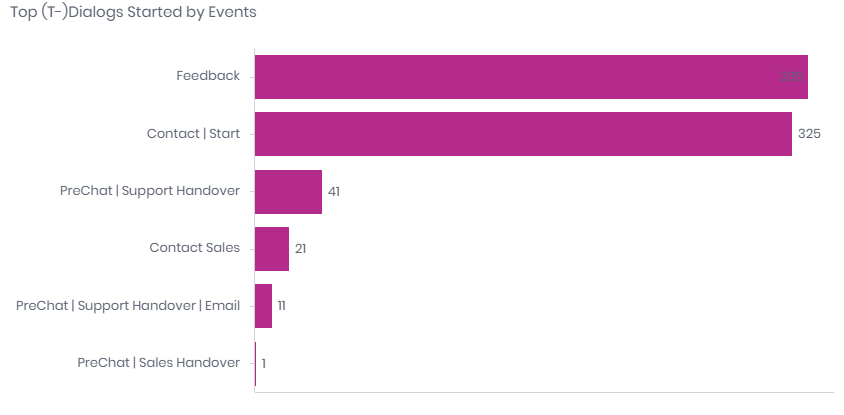
Top (T-)Dialogs Started by Events