Workload
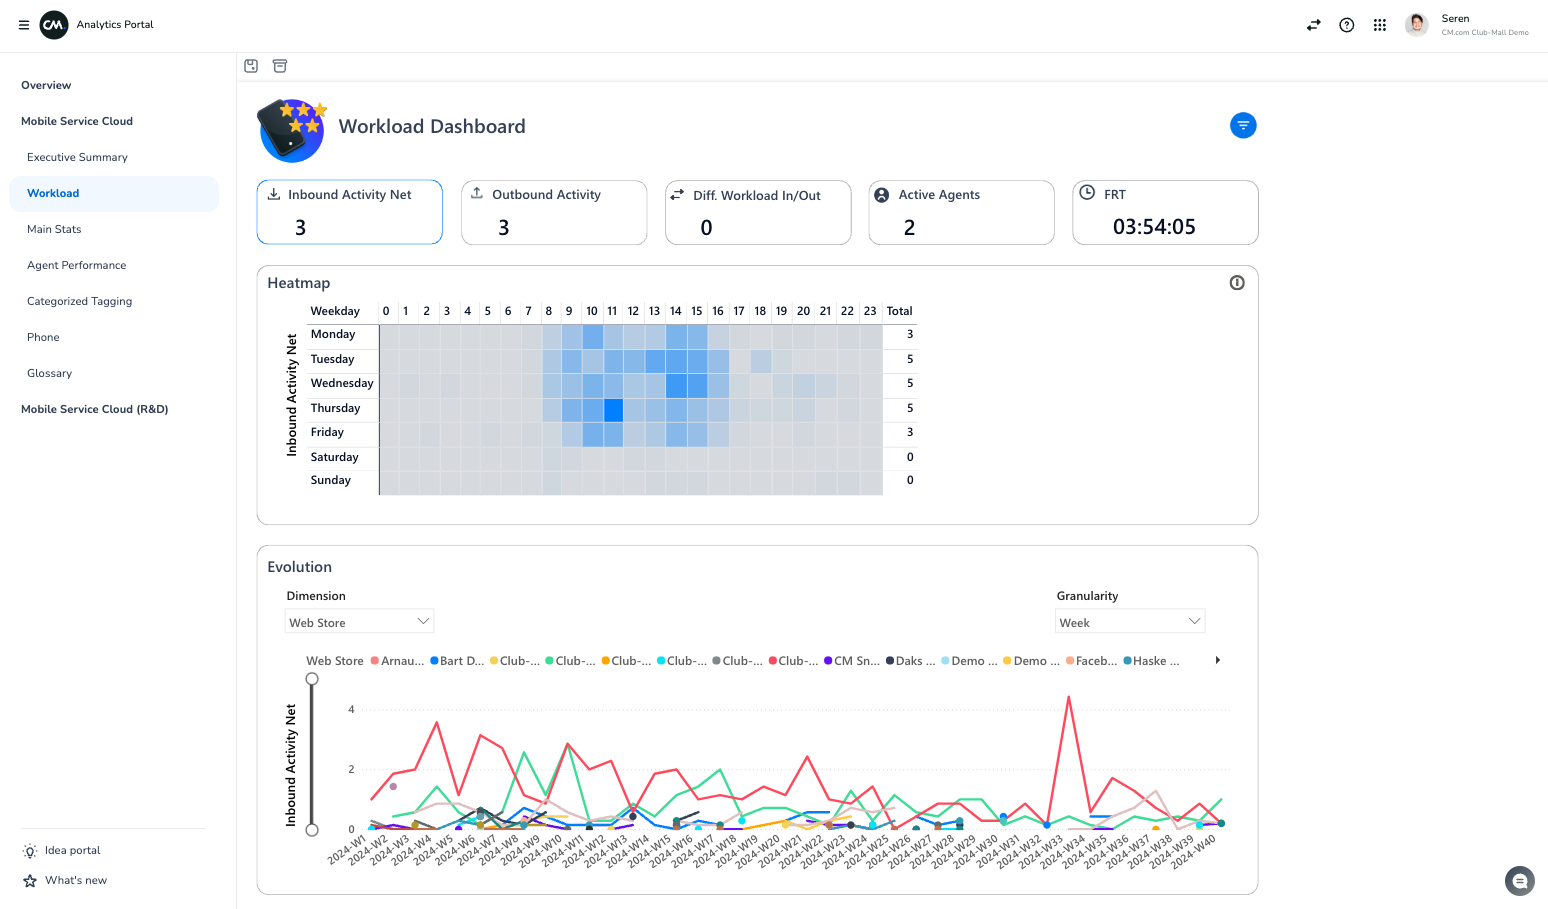
The Workload Dashboard offers heatmaps of the most critical workload metrics within the Agent Inbox domain, including inbound activity, outbound activity, and their differences. It also displays resource availability (active agents) and performance metrics (FRT) during peak workload periods. By clicking on any metric, you can focus on specific categories. Additionally, the dashboard provides time-based trend analysis, enabling you to monitor changes over time and allocate resources more effectively.
Available metrics
The table below highlights all available metrics within the dashboard and their respective descriptions.
Instruction Video
Please take a moment to watch this guidance video about the Workload Dashboard.