
Categories
Closest equivalent to the ‘Categories’ overviews on the existing QBR/Monthly/Weekly Report dashboards
Difference with existing equivalent(s)
What was almost an afterthought on three different dashboards now has its own dedicated dashboard.
You can select a certain type of article specifically instead of always looking at splits between types
No more granularity selection – timeline is daily, but the other charts and table give total information so monthly/weekly totals can be achieved by adjusting the period filter.
Overview of questions asked within a category is a separate drillthrough instead of a drilldown.
Category assignment is no longer dynamic – changing the categorisation in the CMS will no longer affect what is shown in historical data.
Description
Specifically information about the categories associated with activated articles, and the interactions activating those articles in drill-throughs. Only shows information about interactions resulting in articles that are assigned to categories at the moment the interaction took place.
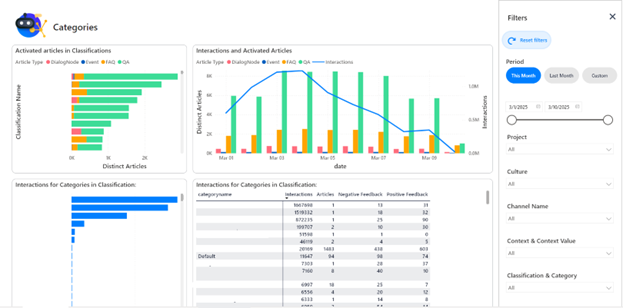
View of the Categories dashboard, filter pane open.
“Activated Articles in Classifications’ shows how many activated articles were assigned to all of the classifications available in the project. Clicking on one will focus the dashboard to that classification. It can also be filtered explicitly using the slicer on the filter panel
“Activated Articles and Interactions’ shows how many articles of a given type were activated each day and how many interactions there were overall.
‘Interactions for Categories in Classification:’ shows the number of interactions in either the Classification with the most articles assigned, or the selected one. The table next to it also shows the number of articles and the amount of positive/negative feedback per category.
From a category you can drill through to see the interactions in that category.
Slicers Specific to this dashboard:
In addition to the standard filters, this dashboard can be filtered on Classification and Category, and on Article Type. The Article Type is similar to the Interaction Type, but it is specifically about the type of Article (regular (QA) Article, Dialog Node, Event, FAQ) used to provide a response. A single Interaction can activate multiple articles of multiple types. Generative AI interactions get their answers via another method and do not activate Articles.
Metrics & Measures:
(Distinct) Articles
Distinct count of the number of activated articles.
Interactions
Number of interactions resulting in articles assigned to a category.
Negative Feedback
Number of interactions receiving Negative Feedback (=Feedback with a score <=0)
Positive Feedback
Number of interactions receiving Negative Feedback (=Feedback with a score >0)
E-learning Video:
https://vimeo.com/1114856536/af4b175b2c