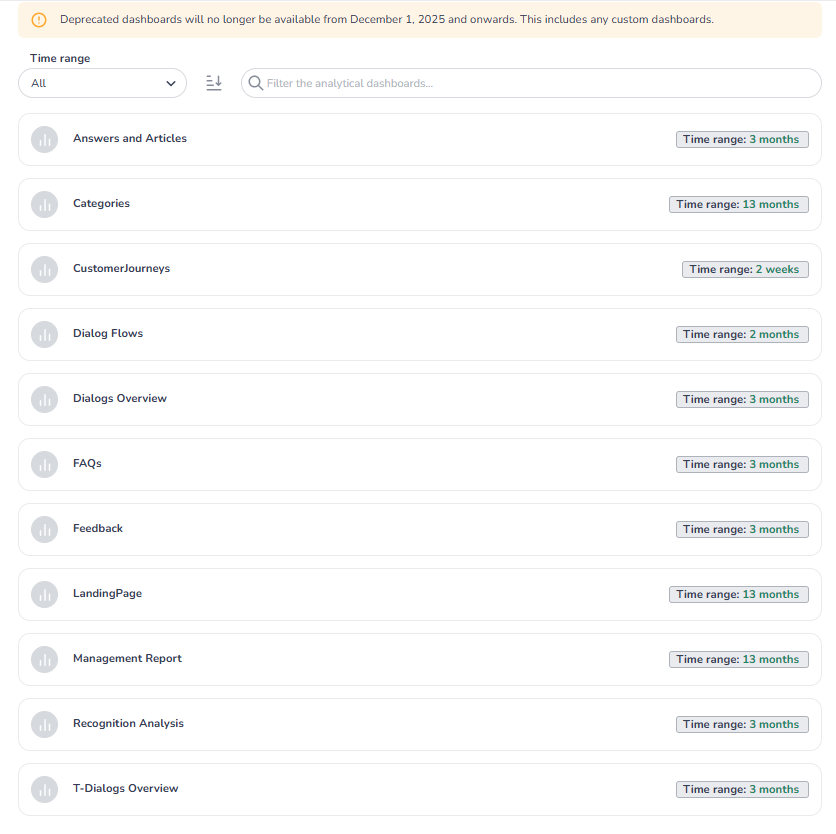
These are the new dashboards for Analytics in Conversational AI Cloud. We’ve consolidated the existing dashboards and so you can more easily find the information you’re looking for. To help you find that information on the new dashboards, we’ve compiled a comparison between the existing and the new dashboards.
Frequently Asked Questions about the new dashboards:
How do I select multiple values from a filter?
Press and hold the Control/Ctrl/Cmd key while selecting values and the filter will multiselect.
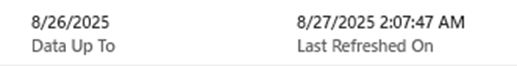
When were the dashboards last updated?
The bottom of the dashboard has the date/time the dashboard was last updated and the latest date for which there is data in the dashboard. Please note that the latest day may not be entirely complete.
The dashboards aren't up to date.
Dashboards are updated daily at slightly different times depending on the dashboard. We aim to have all dashboards up to date with data from the previous day in the morning for West Europe (Amsterdam/Berlin)
How much data is available?
-
Customer Journey: 2 weeks
-
Landingpage, Management Report and Categories: 13 months
-
Dialog Flows (Analytics for any given Dialog): 90 days, selectable 31 days at a time.
-
All other new dashboards: current month + 3 months of history
Can we get data over a longer time period for a given dashboard?
The time periods over which the dashboards provide data have been aligned with the level of detail those dashboards provide.
The number reported on the new dashboard is different from the old one.
The new dashboards also have new logging and different transformations underlying them. We've aimed for equivalence, but small differences are possible. There are also some known, larger differences:
Dialog Starts and/or (Session) Dialog Completion
We've tackled an issue with determining when a Dialog had actually started, leading to under-reporting of Dialog Starts in the old dashboards.
Total # of QA, (T-) Dialog, FAQClick and FAQSearch Interactions
This is affected by the change in determination of Dialog Starts, and we are treating T-Dialog starts the same way. In the old dashboards we always counted T-Dialog Starts in this number, even though the other interactions that started those T-Dialogs were already counted here.
Feedback
We now only ever report one feedback item per interaction – the latest one. This prevents inconsistencies that could arise under specific circumstances in the old dashboards.
I'm missing the % Feedback of Total
This metric was deliberately removed from the Feedback dashboard because the 'total' interactions we were using included all interactions with Answers, regardless of feedback being shown or not.
If you want to calculate a similar (though not identical) metric, you can check the Management Report dashboard and divide the number of Interactions with Feedback by the Total # of QA, (T-) Dialog, FAQClick and FAQSearch interactions.
I'm missing the % No Recognition KPI
Recognition Analysis reports the Recognition Rate. %No Recognition is 100% - Recognition Rate.
Where is the % Dialog Dropouts?
The Dialogs dashboard now reports the Completion, either Session- or Interaction based as a percentage. %Dropouts = 100% - Completion
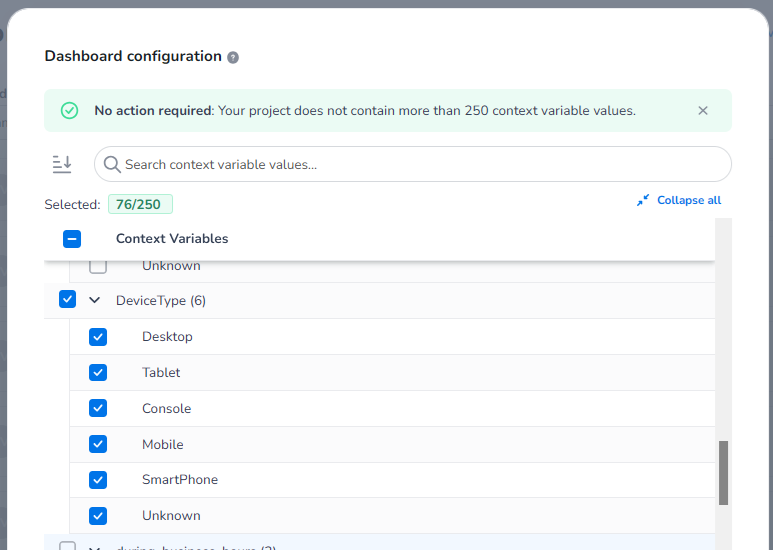
The numbers look different if I filter on a Context
One of the major changes in logging is that we no longer log Context values that have not been defined in the CMS, and we only display Contexts in the Dashboard filters that you have marked for use in the dashboards.
If your context is not available to the dashboard filters over the entire period you're filtering on, you may still see data, but they will only be for those days that the Context was available to the dashboards.
I’m missing a Context in the dashboards
One of the major changes in logging is that we no longer log Context values that have not been defined in the CMS, and we only display Contexts in the Dashboard filters that you have marked for use in the dashboards.
If you don’t see the Context available in the filters at all, please check that the Context value has been defined in the CMS, and that it is marked as available to the dashboards. From the next time the project is published, data with this context should then appear in the dashboards.
Where is the Q&A Questions dashboard?
The functionality of the Q&A Questions dashboard is covered by the Recognition Analysis dashboard. You can find a list of asked questions at the bottom of the Recognition Analysis dashboard.
Activated Articles can be found on the Answers and Articles dashboard.
Where can I see the paths users have taken through my Dialog?
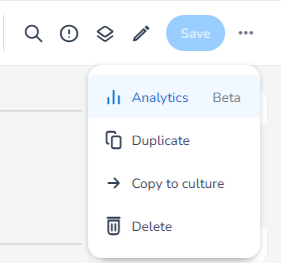
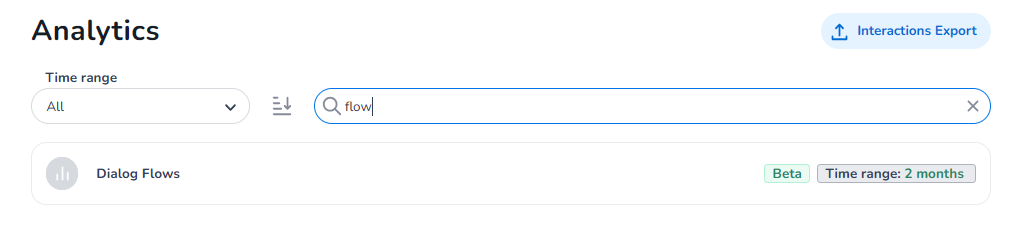
You can get a projection of paths taken through any given Dialog from the 'Analytics' option in the top right of the Dialog, or select the Dialog from the 'Dialog Flows' list on the Analytics tab. This flow visualisation is not filterable by context.
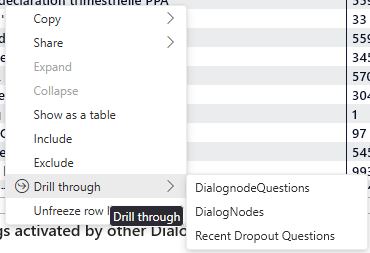
If you wish to see activations of certain Dialog nodes within a context, you can use the Dialogs Overview dashboard with your desired filters and drill through to the DialogNodes (to see activations of Nodes), DialogNodeQuestions (to see the questions that activated those nodes) or Recent Dropout Questions (to see the questions that weren't recognised within the Dialog from a given node).
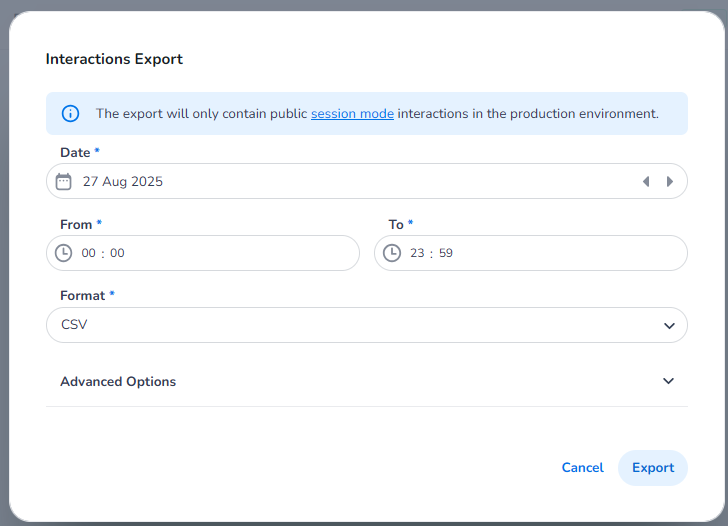
Can I still see which pages my interactions were coming from?
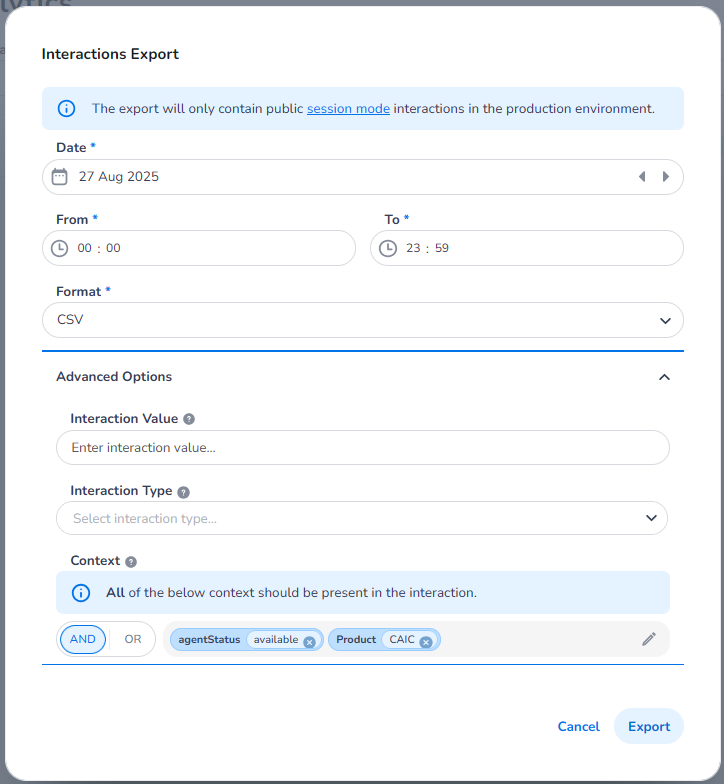
You can use the Interactions Export to get a log of interactions for a given day. This log includes the originating page, if it was logged.
I'd like to have more extensive context filtering options
The Interactions Export can also export interactions filtered by context. This includes all logged contexts (context for which the values have been defined in the CMS) even if those contexts are not available to the dashboards, and these contexts can be combined in more ways than in the dashboards.