
Dialog Flows
Equivalent to the existing ‘Diagram and Nodes’ popup from the Dialogs dashboard.
This is not a new dashboard, rather it is a feature in the Conversational AI Cloud CMS.
The Analytics for any specific Dialog can be accessed from the three dots in the upper right corner of that Dialog’s edit screen:
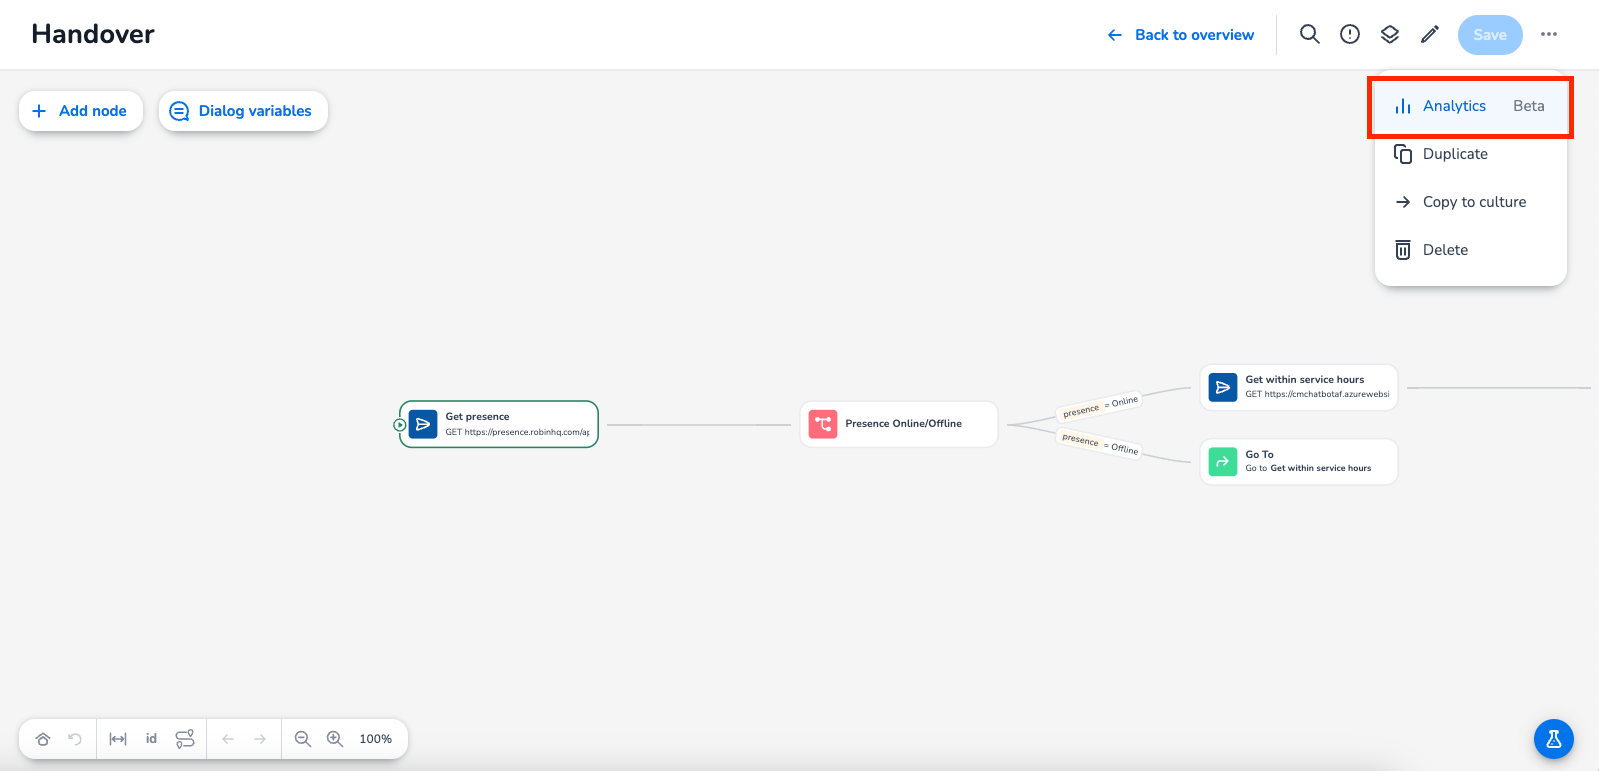
A view of a Dialog called ‘Handover’. The three dots at the top right have been clicked and a menu item called ‘Analytics' has been highlighted.
It can also be accessed from the list of Dashboards by choosing the ‘Dialog Flows’ item, which will then provide you the same list of Dialogs as the Dialog screen, but will open the Analytics directly instead of the edit screen.
This Analytics view is a projection of paths users have taken through the dialog within a selected timeframe, highlighting the often-used and, by extension/omission, least used paths through a Dialog. You can see the number of entries and dropouts for any given node by hovering over the node. Clicking the node will show you from which other nodes users reached this node, and where they went afterwards.
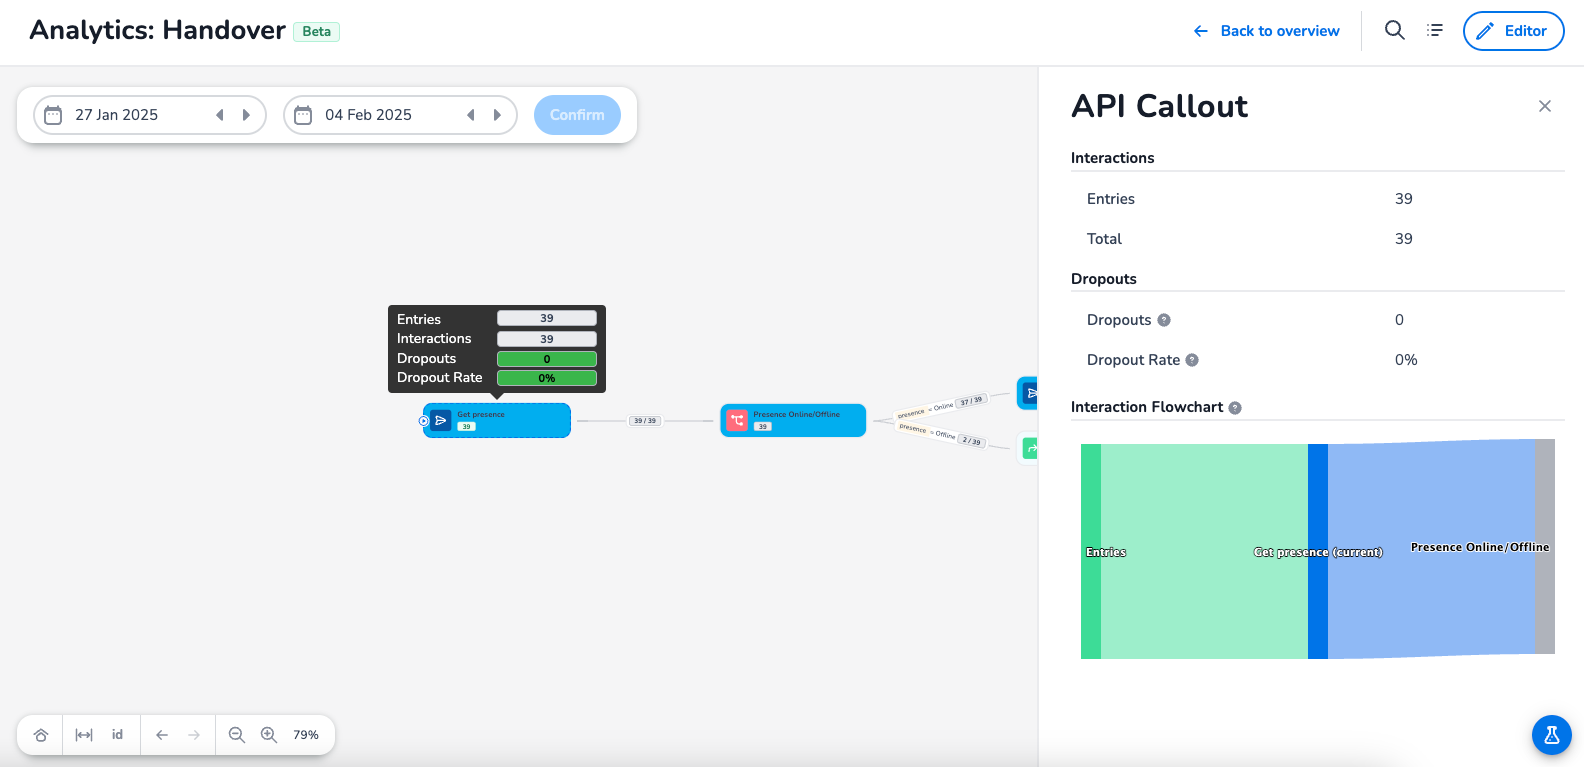
Because this is a projection on the current design of the Dialog, some paths may contain nodes that no longer exist. These paths are still counted on the nodes where they do still exist and the deleted nodes show up in the Interaction Flowchart.