-
Go to the Analytics section of the Dashboard.
-
Stay on the Ticket sales tab
-
Scroll down to the City graph
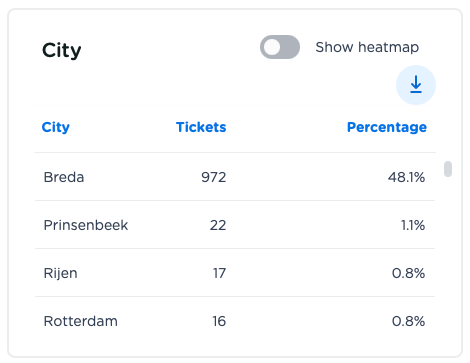
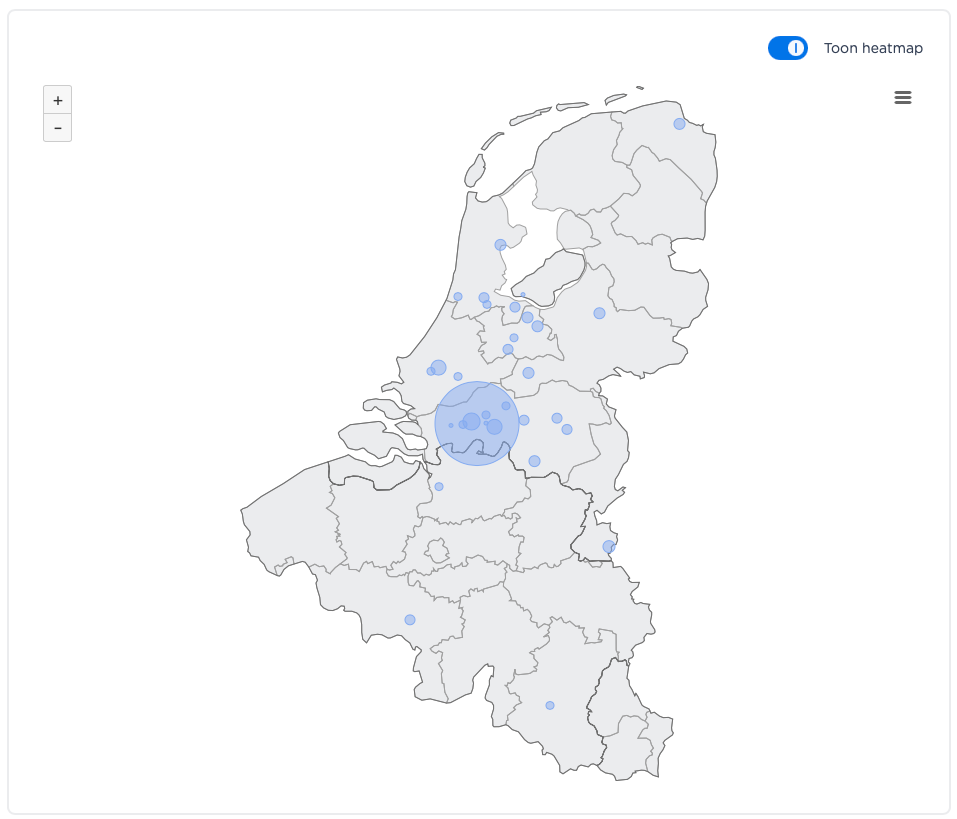
You can also switch to a "Heatmap" view. By means of this heatmap get a graphical view of where your vistors live. Furthermore, by clicking on a certain city, you can see the persons and their details who bought the tickets.