Dashboard → Reporting → Create export
Within Reporting, you can select exactly which data you want to include in your export. Custom questions you have added to your order form will also appear as columns in the export.
This feature gives you a complete overview of everything that has happened within your account, including past events. This makes it easy to compare results, analyse performance, and track data across multiple events over time.
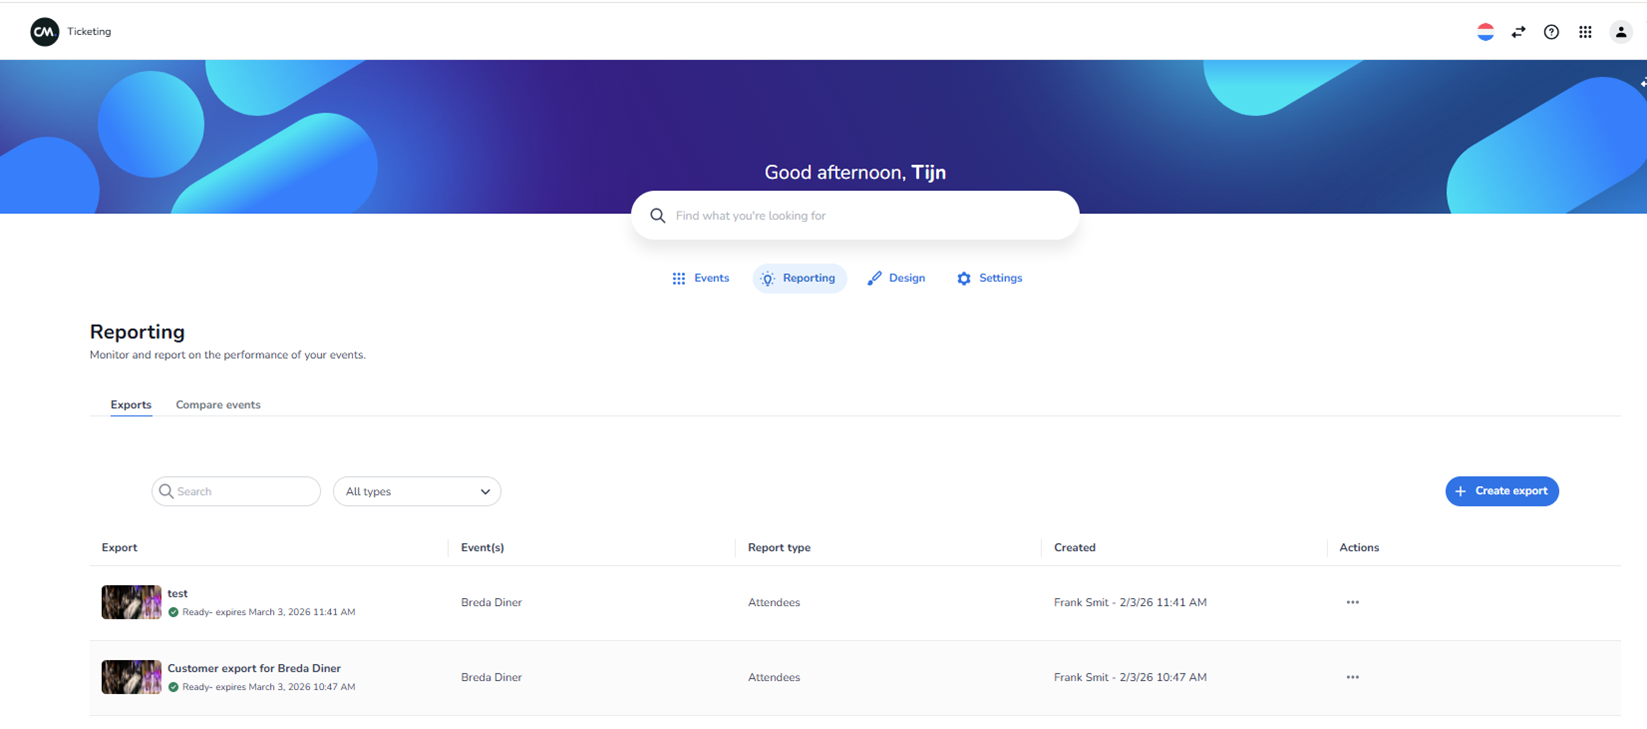
This is the general export page of NxtGn
Screen Context
This screen is visible after:
-
Clicking Reporting in the top navigation.
-
The Exports tab is selected.
The active top navigation tab is Reporting.
Top Navigation Area (Same as Other Screens)
Visible at the top:
-
CM logo (top-left)
-
“Ticketing” label
-
Language selector (flag icon)
-
Help icon (question mark)
-
App/grid icon
-
User/profile icon
Below that:
-
Greeting text (e.g. “Good afternoon, [User Name]”)
-
Global search bar
-
Main navigation tabs:
-
Events
-
Reporting (active)
-
Design
-
Settings
-
Reporting Section Header
Title:
Reporting
Subtitle:
“Monitor and report on the performance of your events.”
Reporting Sub-navigation Tabs
Below the Reporting title:
-
Exports (active in screenshot)
-
Compare events
Exports tab shows previously created reports.
Compare events tab likely allows comparison between events.
Exports Screen Layout
-
Filter Area
Below the sub-navigation:
-
Search field (left)
-
Used to search for specific exports
-
-
Dropdown filter (e.g., “All types”)
-
Filters exports by report type
-
-
Create Export Button
Right side of the screen:
-
Blue button: + Create export
This button allows the user to generate a new export.
-
Exports Table
Below the filter section:
A table listing created exports.
Table columns:
-
Export (export name + thumbnail)
-
Event(s) (linked event)
-
Report type (e.g., Attendees)
-
Created (creator name + date/time)
-
Actions (three-dot menu)
Export Row Structure
Each row contains:
-
Thumbnail image (left)
-
Export name (e.g., test / Customer export)
-
Status indicator:
-
Example: “Ready – expires [date/time]”
-
-
Event name
-
Report type (e.g., Attendees)
-
Created by + timestamp
-
Three-dot menu for actions
Functional Meaning of Elements
-
Clicking export name → Opens export details or download view
-
“Create export” button → Starts export creation flow
-
Search field → Filters visible exports
-
Dropdown filter → Filters by export/report type
-
Three-dot menu → Additional actions (e.g., download, delete)
Important Dynamic Elements
The following are dynamic and account-specific:
-
Export names
-
Event names
-
Report types
-
Creator names
-
Dates and times
-
Number of exports shown
The agent must treat all of these as variable data.
What This Screen Represents
This screen allows users to:
-
View previously generated exports
-
Filter export results
-
Create new exports
-
Manage export files
It is part of the Reporting section of the platform.