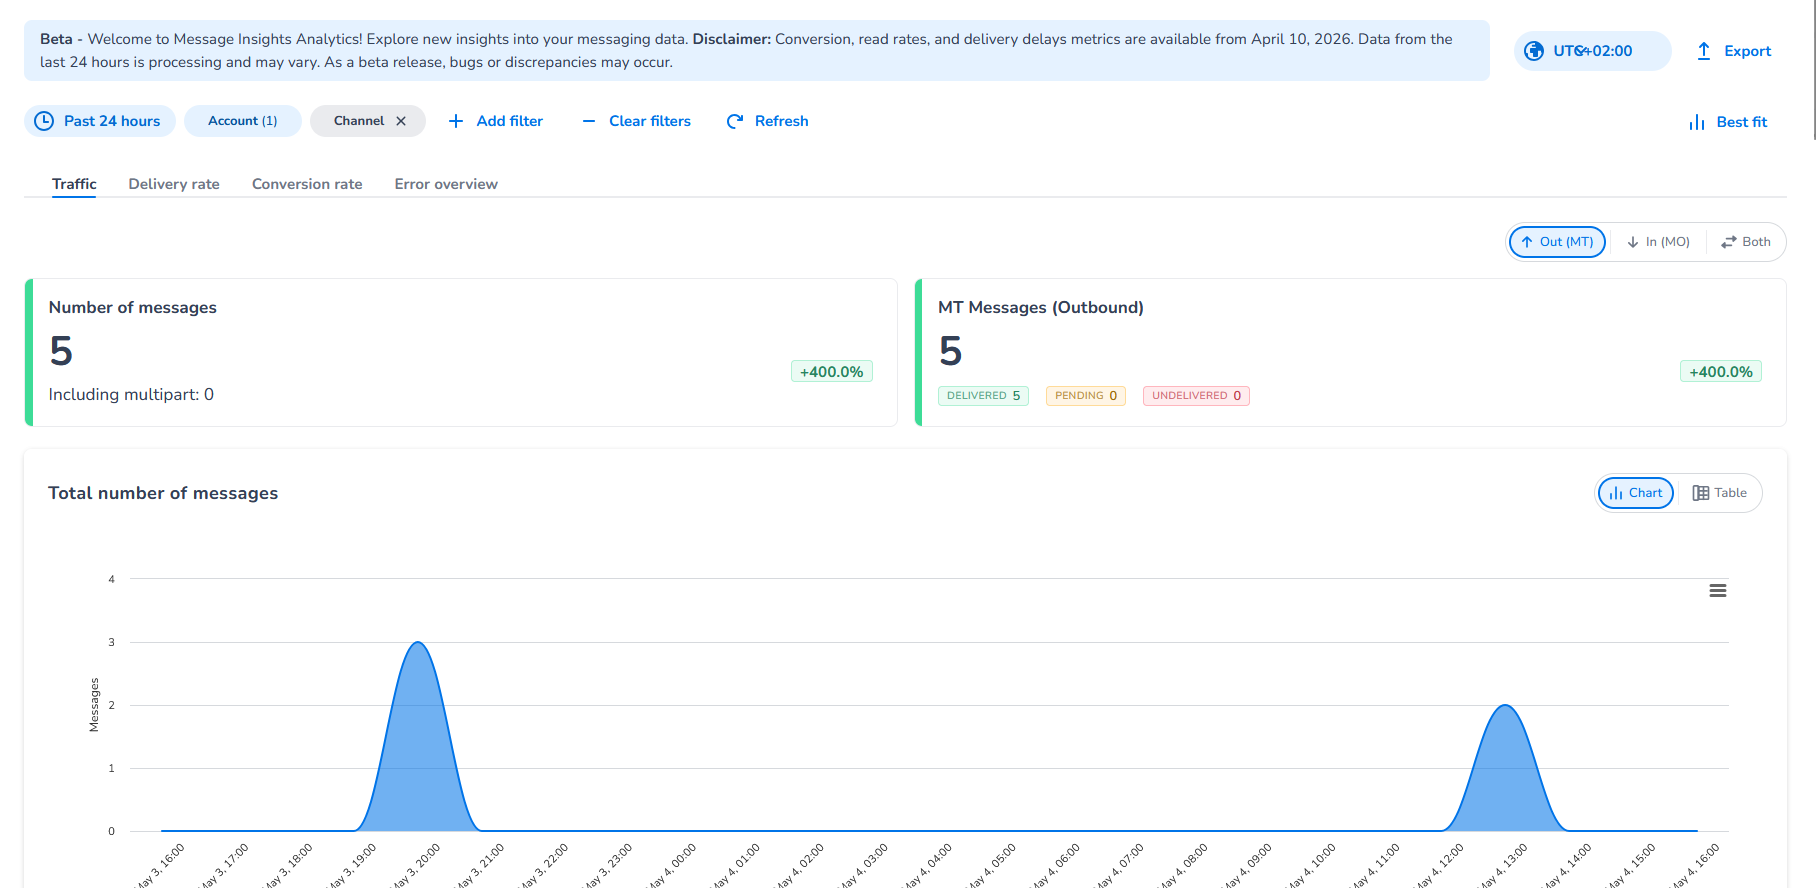
Message Analytics is the analytics module within Message Insights — CM.com's modern replacement for the Messaging Analytics application. It gives you access to four dashboards covering traffic, delivery, conversion, and errors, with up to two years of historical data, flexible filtering, and data export.
Beta notice: Message Analytics is currently in beta. Features and data presentation may change before general availability. Your feedback helps shape the final release — contact your CM.com account manager or support team to share it.
Transitioning from Messaging Analytics? The existing Messaging Analytics application remains available during this transition period. You do not need to switch immediately. The deprecation date is on the 1st of August.
Explanations
What does Message Analytics give me that Messaging Analytics didn't?
Message Analytics extends the previous experience in several meaningful ways:
-
Two years of historical data — data is provisioned of 2024 until now to analyse the most relevant information
-
Four dedicated dashboards — Traffic, Delivery, Conversion, and Error, each focused on a specific operational question
-
Globe view — a visual, country-level map view on Traffic and Delivery dashboards
-
Flexible chart types — switch between spline chart, stacked bar, and table views per dashboard
-
Timezone configuration — set your preferred timezone once and all dashboards reflect it
-
Richer export options — choose panels, format (CSV or XLSX), and granularity per export
Who can access Message Analytics?
Message Analytics is available to all CM.com accounts with access to the Message Insights application. No separate activation is required during the beta period. If you cannot see Message Insights in the CM Platform portal, contact your CM.com account manager. You do not see any data? That is probably because you do not have any messaging capabilities enabled and/or messages send.
What data does Message Analytics cover?
Message Analytics covers outbound and inbound message traffic processed through the CM.com Messaging Platform. You can filter and break down data by:
-
Time period — from hourly up to two years back
-
Account — your account or sub-accounts, depending on your account structure
-
Channel — SMS, WhatsApp Business, RCS, and other supported channels
-
Country — destination or origin country
-
Direction — outbound or inbound
-
Custom Grouping — grouping information that helps segment your messages based on information provided either by your or by CM.com
Is data in Message Analytics real-time?
Message Analytics is not a real-time view. There is a processing delay between message events and their appearance in the dashboards. For near-real-time delivery status, use the Messaging Logging tools.
Configurations
How do I set my timezone?
Timezone is a global setting that applies to all four dashboards. You set it once and it persists across sessions.
-
Open Message Insights in the CM Platform portal.
-
Navigate to Message Analytics.
-
Select the Settings or timezone control — typically shown as a clock icon or timezone label in the top navigation bar.
-
Choose your preferred timezone from the list.
-
All dashboard data and chart axes update to reflect your selected timezone immediately.
If you share dashboards or exports with colleagues in other timezones, note that all exported data reflects the timezone set at the time of export.
How do I adjust the time period and chart granularity?
Each dashboard includes a time period filter and a granularity selector. See How do I filter and configure my analytics view? for full details.
Examples
Example 1: Reviewing two months of SMS traffic after a campaign
Your marketing team ran an SMS campaign across Germany, France, and the Netherlands throughout March and April 2026. After the campaign, you open the Traffic dashboard, set the time period to 1 March–30 April 2026, filter by channel (SMS) and the three relevant countries, and switch to the stacked bar view. You can immediately see daily send volumes per country and identify that traffic in France peaked a week later than Germany — useful context for planning the next campaign.
Example 2: Diagnosing a delivery drop in a specific country
Your operations team notices a delivery rate drop in Nigeria during the last week. You open the Delivery dashboard, filter by country (Nigeria) and the relevant time window, and break down by operator. The colour-coded globe view confirms the issue is isolated to Nigeria. Drilling into the operator breakdown shows one specific operator is responsible for the majority of undelivered messages. You take this directly to the Error dashboard to identify the error codes and escalate with your CM.com account manager.
Example 3: Checking WhatsApp conversion performance month-over-month
You manage WhatsApp Business messaging for a retail brand and want to compare conversion rates between January and February 2026. You open the Conversion dashboard, set the time period to cover both months, filter by channel (WhatsApp Business), and set granularity to weekly. The spline chart shows a clear uplift in week 3 of February — matching a promotional campaign you ran that week.