Description
Overview of activated dialogs and statistics about dialog completion, with a drilldown to see the activations of Nodes and specific questions within a Dialog. Has data over 3 months.
There are separate per-Dialog overviews in the CMS (Dialog Flows) that project path-data onto the existing dialog to substitute for the drilldowns from the similar Sisense Dashboard that are not possible from this dashboard.
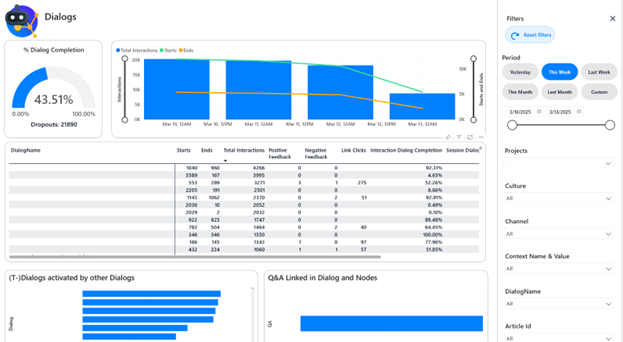
The gauge top right reports the overall Session Dialog Completion and the total number of dialogs that were not completed. The chart next to it shows both the total number of Dialog interactions and the number of Dialog starts and Dialog ends per day.
The table at the center of the dashboard gives an overview per Dialog of a number of measures and an example DialogID. From this table you can drill through to an overview of activated DialogNodes and to the Questions activating those nodes, as well as an overview of questions that dropped out of the Dialog. Clicking on a row will focus the dashboard.
From the drilled overview of Dialognodes, you can also drill through to the Questions that ended up with that node, or the questions that dropped out from that node. In the case of the latter, the users did reach the note you drilled from, but they didn’t continue any further in the dialog because the question they asked was not recognised within the Dialog.
Below the table are bar charts of Dialogs and T-Dialogs that are activated by other Dialogs, and of QA Articles that are linked in Dialog End nodes. Clicking on a bar will also focus the dashboard.
Slicers Specific to this dashboard:
In addition to the standard filters, this dashboard can be filtered on the DialogName and the Article Id. Because this dashboard is only concerned with Dialogs, there is no Interaction Type filter.
Metrics & Measures:
% Session Dialog Completion
Per dialog, this is the number of sessions where the Dialog reached an End node at least once divided by the number of sessions where the Dialog started at least once. Per session and in a general aggregates, this is the sum of unique dialogs that ended in a session divided by the sum of unique dialogs that started in a session.
This dashboard uses a different way of determining (especially) a Dialog Start than the Sisense dashboards do, so the Starts and the Completion metrics may differ between the Sisense dashboard and this one.
Dropouts
The number of Dialogs that started but did not end, calculated on an interaction basis as Dialogs started – Dialogs ended.
Users can drop out of a Dialog by simply not continuing and letting the session expire, by asking a question that is not recognized within the Dialog, or even potentially because a contextual answer within a Dialog node starts a new Dialog without properly finishing the dialog.
(Total) Interactions
The total number of interactions within the dialog, over all the nodes in the dialog including Starts, Ends and anything in between.
Starts
The number of times a Dialog is started.
These dashboards look at the various articles being activated in the interaction and if there are two Dialog articles activated, one of them will always be a Start, even if it is not explicitly marked that way. The existing dashboards based themselves much more on Nodes being explicitly marked as Starts which does not always happen if the Dialog starts with a Capture Input or Logical Step node.
Ends
The number of times a Dialog finishes – reaches an End node.
Positive Feedback
The number of times a Dialog received Positive Feedback.
Negative Feedback
The number of times a Dialog received Negative Feedback.
Link Clicks
The number of Links that were clicked from Answers given in the Dialog.
Interaction Dialog Completion
Ends/Starts.
The per-Session Completion % is an indication whether a user ever found an end to a Dialog. The Interaction Completion % gives an indication of how often users start and then end a Dialog. This percentage can come out higher than 100% if people often go back within a Dialog to select different end nodes. It can also come out much lower than the Session Dialog Completion if users start the Dialog several times in a session before they ever get to the end of it. This dashboards reports both so you can compare them, but the Session Dialog completion is used as a KPI on other dashboards as well.
Dropouts through Questions
The number of questions that were asked while a user was within the Dialog, but which were not recognised by the follow-up node in the Dialog, therefore abandoning or dropping out of the Dialog. These Dropouts via Questions only represent users dropping out of the Dialog via asking a Question or non-working Dialog buttons/options, not users who dropped out of the Dialog some other way. This metric does not directly correspond to Ends - Starts but it can help you find Dialogs where you need to improve the recognition.
E-learning Video:
Notes
Equivalent to the deprecated main Dialogs dashboard.
Differences:
-
3 months of data instead of 13
-
improved calculation of Dialog Completion
-
Main table reports the/an ID of the Dialog with the given name
-
Reporting on only Starts, Ends and Total interactions in the Dialogs; Starts are determined differently.
-
The drillthrough to a projection of the paths taken through the Dialog onto the Dialog structure is now available in the Analytics for a specific Dialog (also known as the Dialog Flows) in the CMS. This is not available in the Analytics Portal, only in the Conversational AI Cloud CMS.
-
Any visualisation regarding the specific paths taken through the dialog anymore can now be viewed in the Dialog Flow analytics in the Conversational AI Cloud CMS.
-
There is a drillthrough to activations of individual nodes and the questions activating those nodes.
-
With a new drillthrough, you can now see the questions that dropped out of a Dialog and which node they dropped out from.