Landing Page
Description
Very high-level overview with limited filtering. Will eventually have 13 months of data.
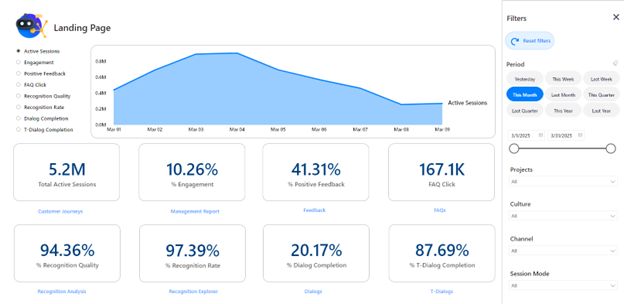
The radio buttons next to the area chart allow you to select which KPI is visible on the timeline. There is a summary of the other KPIs underneath. In the filter pane, you can either set the Date filter to a sliding range, or select from a number of options.
In principle, every KPI on this dashboard relates to a different dashboard where further investigations can be undertaken
Slicers Specific to this dashboard:
This dashboard only has standard slicers. It does not have the slicer for Context & Contextvalue
Metrics & Measures:
Active Sessions
The number of sessions started on a given day that had interactions other than showing Categories and/or FAQs, Events or Dialogs started by Events but with no further interaction from the end user.
The Customer Journeys dashboard allows exploring all interactions in active sessions of the past week/2 weeks in great detail.
Engagement
Active Sessions/All Sessions
The Management Report dashboard gives a still high-level but more detailed view of how users interacted with the Conversational AI Cloud.
Positive Feedback
Interactions that received Positive Feedback/All interactions that received Feedback
An indication of how happy your end users were with the Answers of the Conversational AI Cloud.
Feedback can be explored in more detail on the Feedback dashboard and general counts of Positive and Negative feedback are given on other dashboards as well.
FAQ Clicks
The number of FAQClick interactions.
If you offer FAQs, this counts how many clicks they had. More details about this can be found on the FAQs dashboard.
Recognition Quality
Average Recognition Quality
For Q&A Interactions recognized using Entity Recognition or Exception Events only (and those that are not recognized at all) – a measure of how much of the user’s question is covered by the entities and/or tokens used to match it. Exception Events/Overrides get 100% here because they are intended to match more generally than entities. No Recognition gets 0% because we could not match a user question at all.
For recognition via Intent or GenerativeAI/HALO we cannot generate a meaningful Recognition Quality because the method of matching in order to provide a response is too different.
Recognition for Q&A Interactions, including through Intents and GenerativeAI/HALO, can be analyzed in detail on the Recognition Analysis dashboard.
Recognition Rate
QA Interactions where Interactiontype <> ‘No Recognition’/All QA Interactions
The percentage of QA interactions we actually provided an answer for through whichever means, including Intents and GenerativeAI/HALO
In addition to the Recognition,which can be analyzed using the Recognition Analysis dashboard, the Answers can also be further explored using the Answers dashboard. This dashboard also includes Answers provided for other interaction types.
Dialog Completion
Dialogs finished at least once in a session/Dialogs started at least once in a session.
T-Dialog Completion
Transactional Dialogs finished at least once in a session/Transactional Dialogs started at least once in a session
E-learning Video:
Notes
This is the closest equivalent to the deprecated KPI Overview dashboard.
Major differences:
-
The overview of interactions per session can now be found on CustomerJourneys.
-
You can still find most of the activated InteractionTypes on Management Report.
-
The KPIs are precalculated based on Active/Inactive sessions so the Session Activity filter is no longer necessary.
-
The AutoDialog interactiontype is fully deprecated.
-
Linkclicks are reported on the Answers and Articles dashboard.