Description
High-level but more detailed information. Should eventually have 13 months of data.
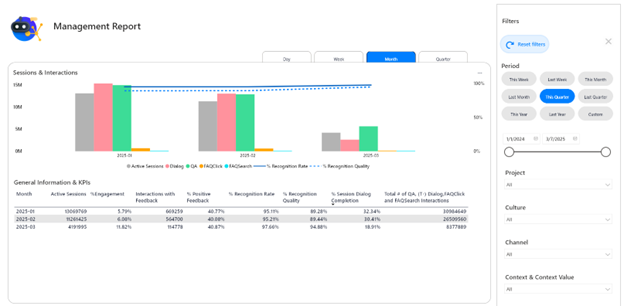
This dashboard can be filtered on Context and Contextvalues. The buttons at the top right will let you select the granularity of the central table and chart from daily to quarterly.
The chart at the top gives a summary of some metrics, particularly the counts of specific interaction types. A number of metrics including the KPIs from the Landing Page are available in the table in the center of this dashboard.
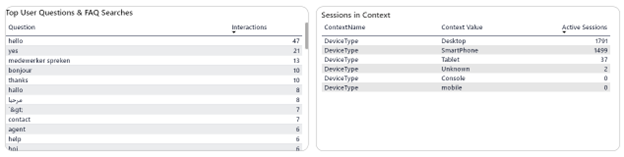
The table at the bottom left gives a quick overview of often-recurring Q&A and FAQSearches, to gain some insights into what topics are important to the project. This only shows questions/searches that pass an occurrence threshold over the past 13 months, even if that means the top x is not entirely filled.
The table at the bottom right gives an overview of session counts for Contexts + Context Values that are taken into the dashboards. Changing which contexts are logged for the dashboards will affect only future data, not the historical record.
Slicers Specific to this dashboard:
This dashboard only has standard slicers.
Metrics & Measures:
Active Sessions:
The number of sessions where end users had interactions with the chatbot other than Events, showing FAQs or Categories, or Dialogs started by Events.
Dialog Interactions:
The number of interactions where maininteractiontype = Dialog. This does not include Dialogs started by Events, FAQClicks or Q&A.
FAQClick interactions:
Clicks on FAQs. (Interactions where maininteractiontype = FAQClick)
QA Interactions;
AKA Q&A. Interactions where maininteractiontype = QA. Direct user questions
FAQSearch interactions.
Interactions where maininteractiontype = FAQSearch. Searches for specific FAQs.
Recognition Rate:
QA Interactions where interactiontype <> ‘No Recognition’/All QA Interactions
The percentage of QA interactions we actually provided an answer for through whichever means, including Intents and GenerativeAI/HALO
Recognition Quality
Average Recognition Quality
For Q&A Interactions recognized using Entity Recognition or Exception Events only (and those that are not recognized at all) – a measure of how much of the user’s question is covered by the entities and/or tokens used to match it. Exception Events /Overrides get 100% here because they are intended to match more generally than entities. No Recognition gets 0% because we could not match a user question at all.
For recognition via Intent or GenerativeAI/HALO we cannot generate a meaningful Recognition Quality because those matches work in an entirely different way.
Engagement
Active Sessions/All Sessions
Interactions with Feedback:
The number of interactions that received feedback
Positive Feedback
Interactions that received Positive Feedback/All interactions that received Feedback
(Session) Dialog Completion
Dialogs finished at least once in a session/Dialogs started at least once in a session.
Total Number of QA, (T-) Dialog, FAQClick and FAQSearch interactions:
Total number of interactions directly by users that are not LinkClicks or Feedback.
Interactions:
The total number of interactions of a given type. In this case, Q&A and FAQSearches.
E-learning Video:
Notes
Close equivalents in the deprecated dashboards: Quarterly Business Report, Monthly Report, Weekly Report, PM Overview
Differences:
-
Combination of the main information contained on four different previous dashboards with different granularities.
-
Possible to switch granularity on the dashboard itself.
-
Category information has been moved to the Categories dashboard
-
Detailed information about Questions without Recognition is available on the Recognition Analysis dashboard.
-
Answers with Negative Feedback are available on the Answers and Articles dashboard.
-
Information about Clicked FAQs has been moved to the FAQs dashboard (or the Categories dashboard).
-
An overview of Dialog Completions can be found on the Dialogs Overview
-
Top asked/searched questions are still on this dashboard but the full list for the last three months is available on the Recognition Analysis dashboard.
-
Find information about Event activations on the Answers and Articles dashboard.
-
Fewer details about Feedback, only the KPI and total number of feedback interactions (more details on the Feedback dashboard)