Description
Specifically analyze direct-input questions ('QA') to improve recognition, both via Intents and via Entity or token recognition. Available over 3 months. This dashboard covers user questions that are (not) answered directly by recognition, either via Exception Events (Overrides), Intents, Entity Recognition, or Generative AI. These questions can start Dialogs, but any progression through Dialogs is handled in other dashboards.
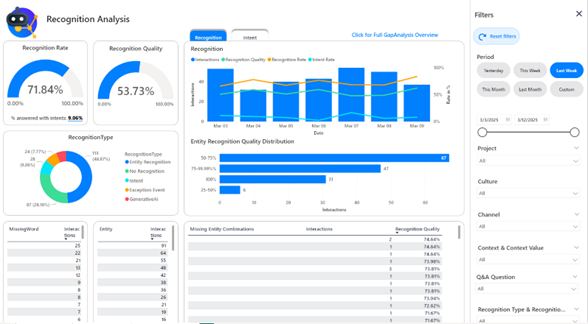
The two gauges at the top left show the overall Recognition Rate; being the percentage of user questions receiving an Answer, and Recognition Quality, showing how well Entity Recognition covered questions (not) Answered using Entity Recognition. The donut chart below these shows what types of recognition were used in what proportions to answer user questions.
The two charts on the right by default show the numbers of questions per day, and timelines for the Recognition Rate, Recognition Quality, and Intent Rate, as well as the distribution of Recognition Quality across the questions that were recognized using Entity Recognition.
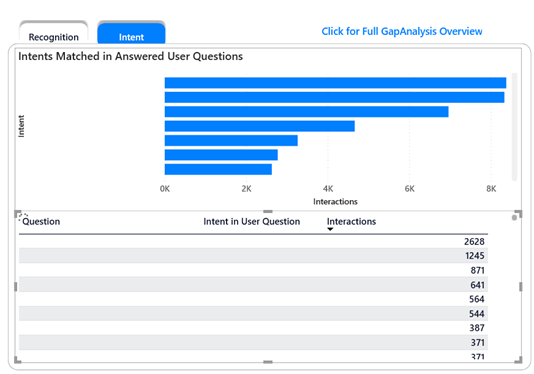
The second tab shows more detailed information about which Intents were used to match user questions, as well at the top 100 user questions answered via Intents.
The row below the various charts contains three tables concerned with Entity Recognition. In all three tables, clicking on a row in the table will focus the dashboard on data related to that row.
The first table on the left shows the most occurring words from user questions that haven’t yet been marked as either stopwords or incorporated into Entities. If there are high counts in this table, you should consider adding those words to either stopwords or an Entity
The middle table shows which Entities have been detected in user questions. If an Entity stands out here, you should check that it is not too broad and recognizing something you did not intend.
The table on the right shows which combinations of Entities have been detected in your user’s questions, but where the recognition for this combination has not been entirely covered by the example questions in your CMS. This could be because your example questions with the articles don’t fully use the terminology that your users do, or because part of the recognition happened through words that are not (yet) in entities. If two entities occur together a lot, they may overlap; this should be avoided.
From all three of these tables it is possible to drill through to all the Questions related to the row. An entire Gap Analysis log can be loaded from link at the top right of the dashboard

Intent, Article IDs, Answer, Interactions and Recognition Quality columns.
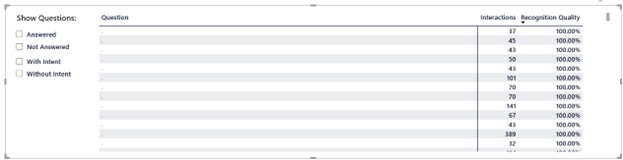
the toggles that control what is shown in the table.
At the bottom of the dashboard is a table showing the top 200 questions for your project. By default, this is the top 200 overall user Questions (depending on the rest of your dashboard filters), but the toggles next to the table can be used to filter this to only Answered or not-Answered questions and questions in which an Intent has been detected or questions in which no Intent has been detected.
Slicers Specific to this dashboard:
In addition to the standard Slicers, you can filter this dashboard on the Q&A Question that a user typed in, as well as on the Recognition Type and a range of Recognition Quality.
Metrics & Measures:
Recognition Rate
The number of user questions that did not receive an Answer divided by all user questions.
Recognition Quality
For Entity Recognition, a measure of how well the user question overlapped with the example question in the article answering the question, making this a measure of how well your Entity Recognition is covering your user’s questions. The number presented is the average over the interactions included in the widget or row. The Recognition Quality is not a meaningful calculation for user questions answered via Generative AI/HALO or via Intents, so this calculation does not include those user questions
% Answered with Intents /Intent Rate
The number of user questions that received an answer using Intents, divided by the total number of user questions. This gives an indication of how well your Intents cover your user’s questions.
Interactions
The number of Interactions that featured a given question, missing word, Entity, Entity Combination etc.
E-learning Video:
Notes
Deprecated equivalents: Recognition Analysis, Q&A Questions
Differences:
-
3 months of data instead of the 2 from Sisense Recognition Analysis or the 13 months of Q&A Questions
-
Activations of Entities are reported on the dashboard itself
-
Questions (not) Answered With/Without intents are in a single table that can be filtered on the dashboard itself; they are no longer separate and always-visible tables.
-
Searching for a question now only allows for one search without and/or conditions and it is always a ‘contains’ search
-
Unlike Q&A Questions, feedback is not reported at all on this dashboard. See the Answers and Articles dashboard or the Feedback dashboard for information about that.