Description
Overview of activated Transactional Dialogs (T-Dialogs) and statistics about T-Dialog completion, with a drillthrough to see the interactions within a specific T-Dialog. Has data over 3 months.
T-Dialogs are a deprecated feature in Conversational AI Cloud (the Capture Input/API Callout features of regular Dialogs should be used instead) but this dashboard provides analytics until all Transactional Dialogs have been converted.
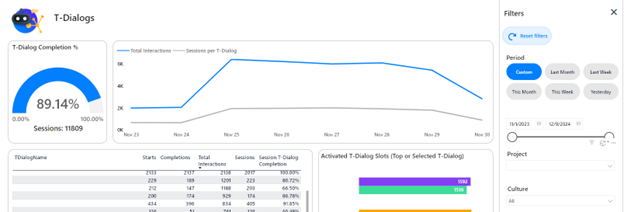
The gauge at the top left shows the T-Dialog Completion % and reports on the number of Sessions featuring T-Dialogs. The line chart next to it shows the number of interactions in T-Dialogs and the number of sessions with T-Dialogs per day.
The table at the bottom left shows Starts, Completions, Interactions, Sessions and Session T-Dialog Completion per T-Dialog. Clicking in the table will focus the dashboard.
The bar chart next to the shows the activations of the slots for either the most activated or the selected T-Dialog. The order of the nodes is not necessarily the order in which they were activated for the user, so where a user starts and ends within a T-Dialog can vary. This is why this bar chart reports separately on activations, completions and intermediate interactions.
Slicers Specific to this dashboard:
In addition to the standard filters, this dashboard can be filtered on T-Dialog name and the T-Dialog Slot name and the Article IDs (Slot IDs)
Metrics & Measures:
(Session) T-Dialog Completion %
Per T-Dialog, this is the number of sessions where the T-Dialog reached an End slot at least once divided by the number of sessions where the T-Dialog started at least once. Per session and in a general aggregates, this is the sum of unique T-Dialogs that ended in a session divided by the sum of unique T-Dialogs that started in a session.
Sessions / Sessions per T-Dialog
The sum over all T-Dialogs of the number of sessions where a T-Dialog is started at least once. Because we calculate this per T-Dialog, if projects have more than one T-Dialog in a session this may be slightly overestimating the number of sessions per T-Dialog as a general aggregate, but give the correct number when the dashboard is focused on a single T-Dialog.
Total Interactions
The total number of interactions within a T-Dialog, including Starts and Completions.
Starts
The total number of times a T-Dialog was started.
Completions
The total number times a T-Dialog was completed – meaning all its slots were filled.
Intermediate
Any interaction in a T-Dialog that isn’t a Start or a Completion
Notes
Close equivalent of the deprecated T-Dialogs dashboard
Differences:
-
3 months of data instead of 13
-
Most information is presented in the table at the center of the dashboard, so there are no more bar charts with most activated Transactional Dialogs or completion %.
-
Transactional Dialog Answers are now available in the drillthrough
-
Sessions are calculated per T-Dialog instead of overall; can lead to higher counts if multiple T-Dialogs happen in a single session.
-
Starts of T-Dialogs are explicitly determined and reported on instead of only Ends