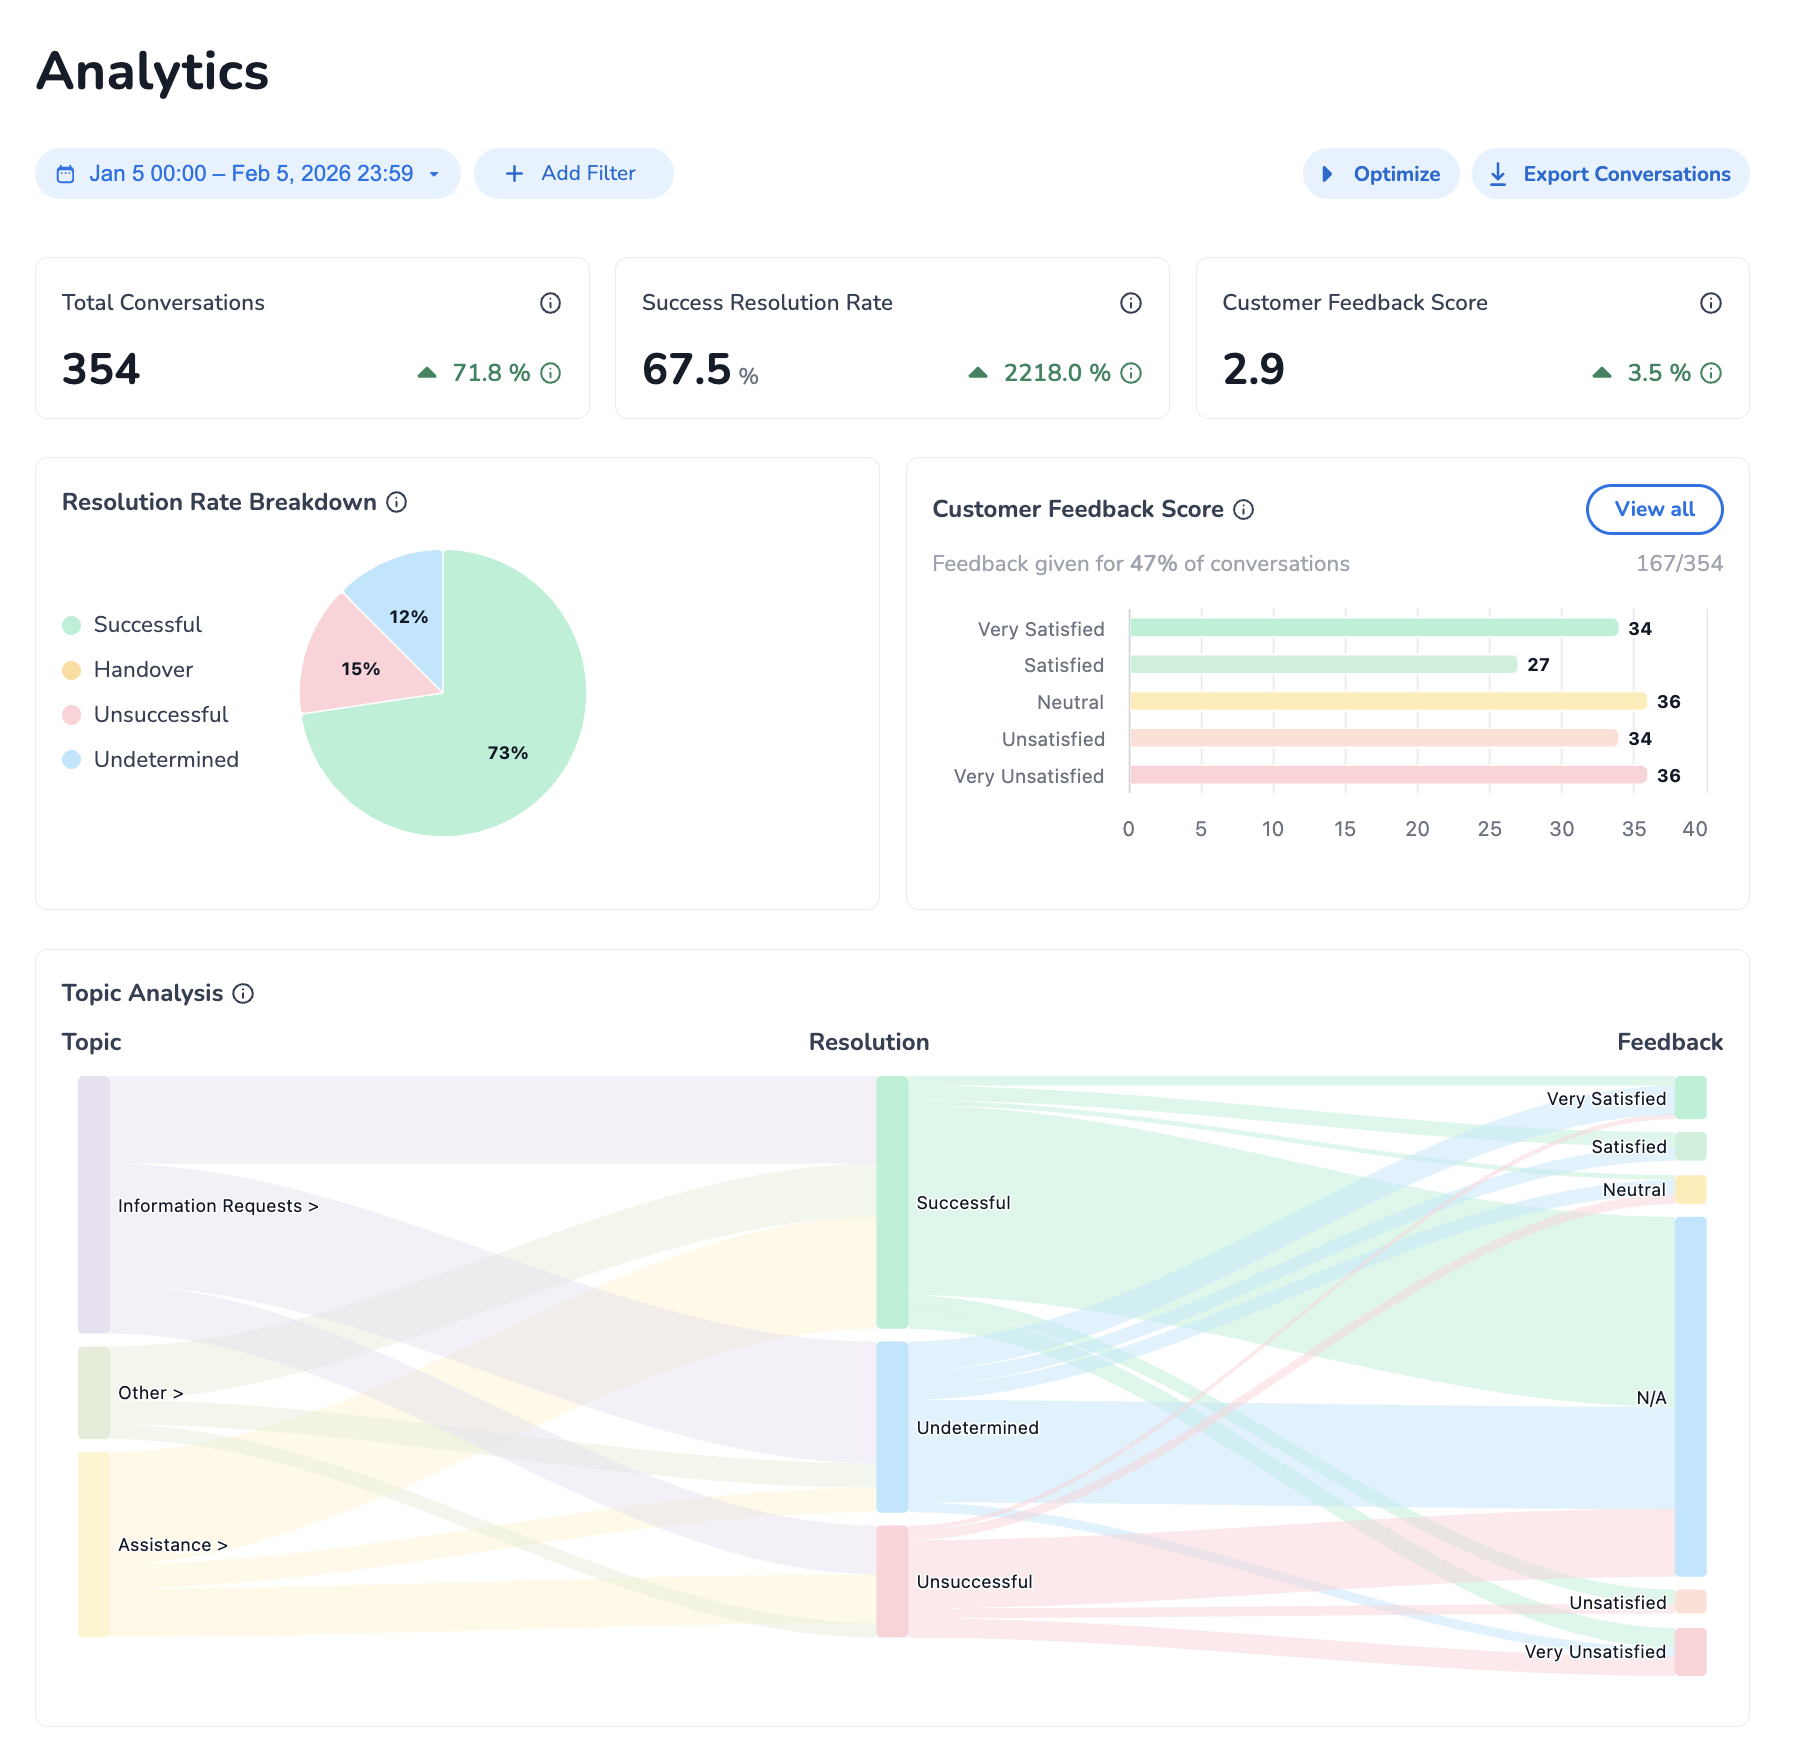
Analytics in HALO allow you to easily more insights into how well HALO is performing. These insights come together in the ‘Analytics’ page. In this Analytics overview, you can track the following main insights:
-
Conversation Resolution – how effectively HALO handles conversations autonomously
-
Customer Feedback – how satisfied users are with their interaction with HALO
-
Conversation Topic - what topics and subtopics HALO handles
Conversation Resolution
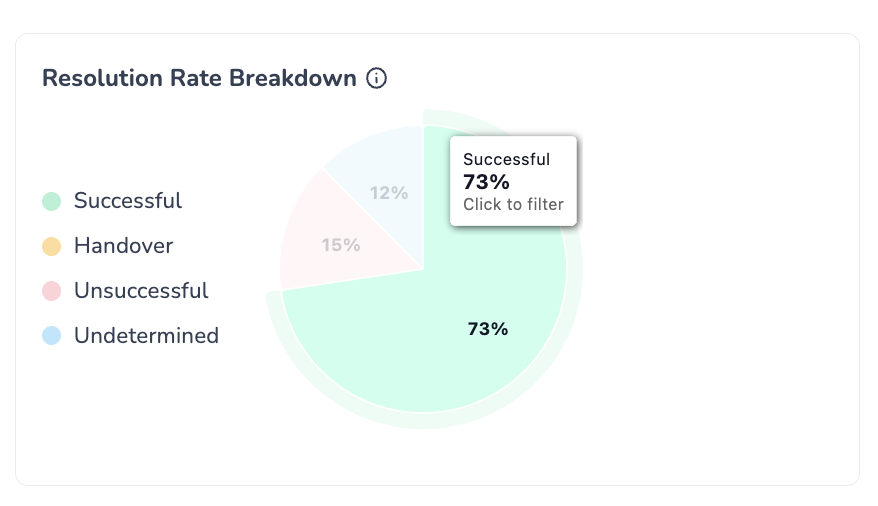
You can click on a type of Resolution to filter the Analytics overview to only include conversations with this type.
The Conversation Resolution metric measures how effectively HALO Agents resolve user queries.
HALO assigns a resolution status after a conversation ends, determined by a period of inactivity. Until then, the status remains Pending.
Conversation Analytics like Resolution Status and Topic/Subtopic are determined after a period of conversation inactivity of approximately 30 minutes.
Once classified, a conversation falls into one of the following five resolution statuses:
-
Resolved
HALO handled the user’s request appropriately, with no remaining open questions. The conversation was completed fully autonomously. -
Undetermined
It is unclear whether the user’s request was fully handled. This typically occurs when the issue was only partially resolved or the response may not have been fully satisfactory. -
Unresolved
HALO was unable to help the user appropriately. The user remains with unanswered questions or expressed clear dissatisfaction. -
Handover
The conversation was transferred to a human agent for further assistance.
To ensure accurate analytics, Handovers need be explicitly logged. This means Handovers currently managed via Tools need to be transformed to use the Handover Tool Step. Handovers currently managed via Static Handover Flows are already logged as such automatically.
Adjusting Conversation Resolution Statuses
It is possible that you do not fully agree with the Resolution classification that HALO has determined automonomously. This can be the case for example if HALO has classified the conversation as unresolved, but the agent correctly did not handle the user request since it is out of scope for your setup, or if HALO classified the conversation as undetermined because it was unsure, but you can accurately classify the conversation since you have the entire context of the HALO environment.
You can adjust the conversation resolution status after opening a conversation from the Optimize page: Optimize
Adjusting the status of a Conversation Resolution does not only help improve the Analytical insights for this conversation, but your resolution overrides will help HALO improve future automatic Conversation Resolutions. This means that your own expertise of the HALO environment is used automatically for future conversations and, as your rate more conversations, HALO is able to automatically do this for you, allowing for automatic accurate Analytics over time.
Technically, manual conversation resolution overrides will be used for future classifications if the new conversation has the same Subtopic as a conversation with a manual override.
Learn More with about the HALO Analytics Conversation Outcomes Overview
Gain a clear understanding of the HALO Analytics dashboard with our dedicated e-learning video. This video provides a step-by-step walkthrough of the Conversation Outcomes feature, explaining how to interpret the data and insights displayed.
Or check how to investigate and improve resolution in the following video.
Want to understand customer feedback in more detail? Check out the following E-learning.
Feedback
You are also able to ask end users for Feedback on how satisfied they were with HALO. When Feedback is configured, you can see the distribution of the Feedbacks that were given to your HALO Agents in the following way:
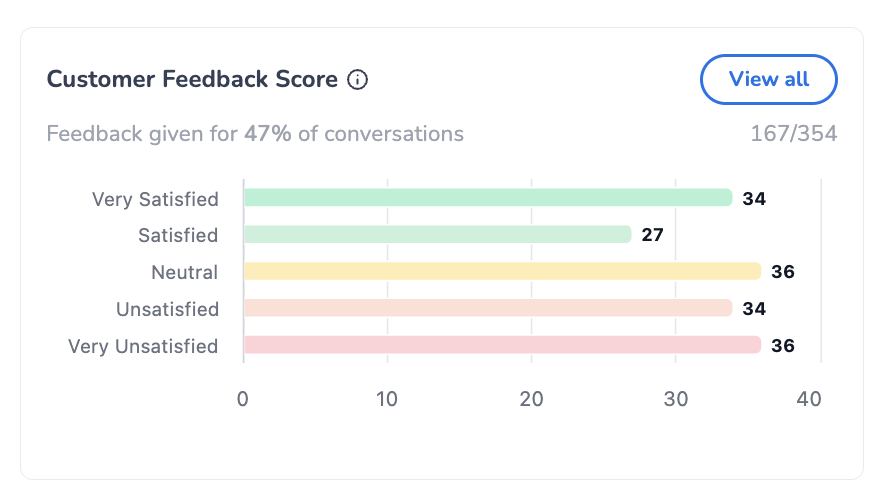
You can click on a type of Feedback to filter the Analytics overview to only include conversations with this type.
If you click on ‘View all’, you are directed to the following page:
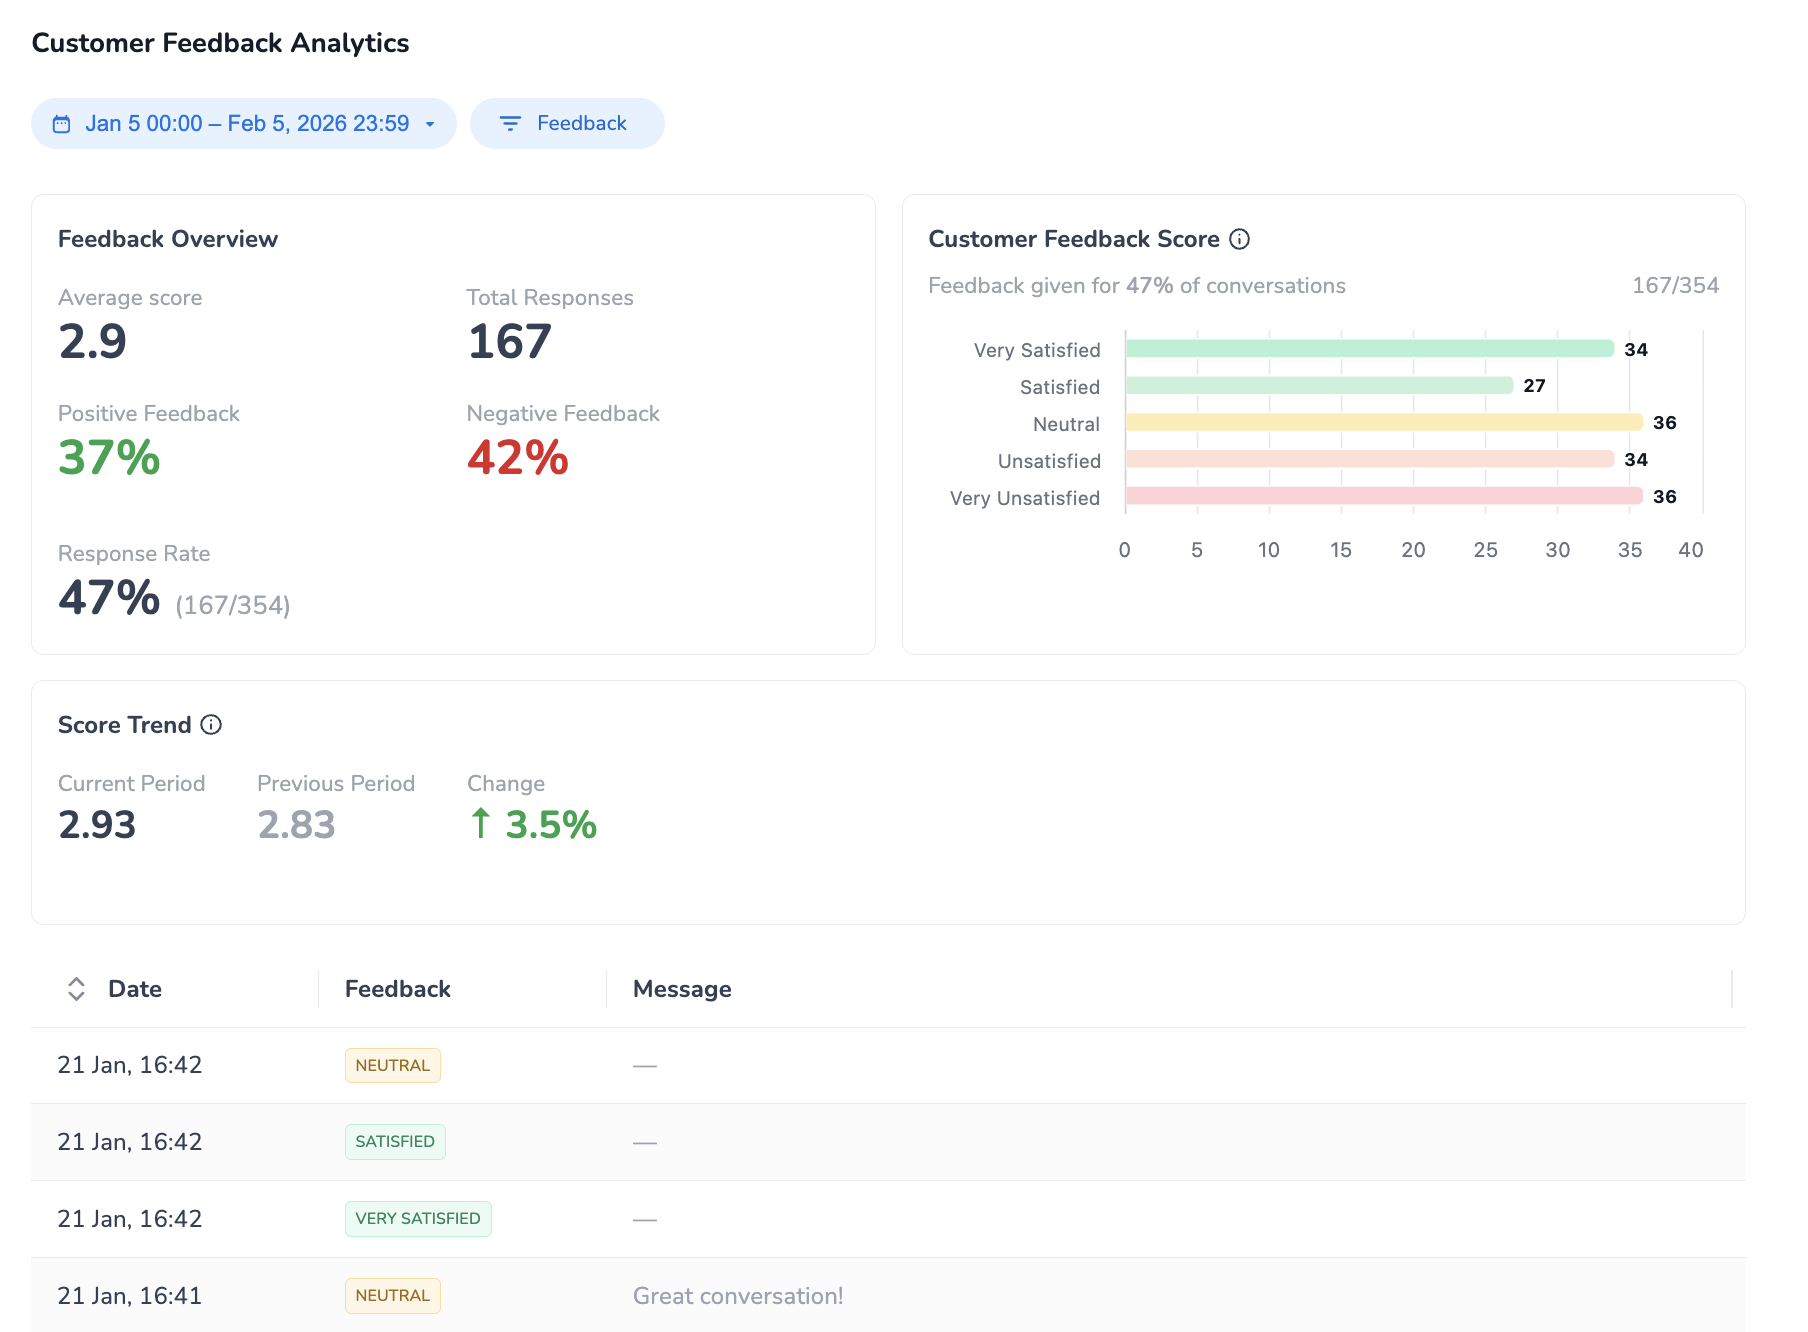
Within this view, you can check several statistics on the provided Feedbacks, and can see the list of all provided Feedbacks with the optional Messages that users submitted with the Feedbacks.
Configuring Feedback
To enable users to provide Feedback, you can adjust your WebConversations configuration in the following way:
-
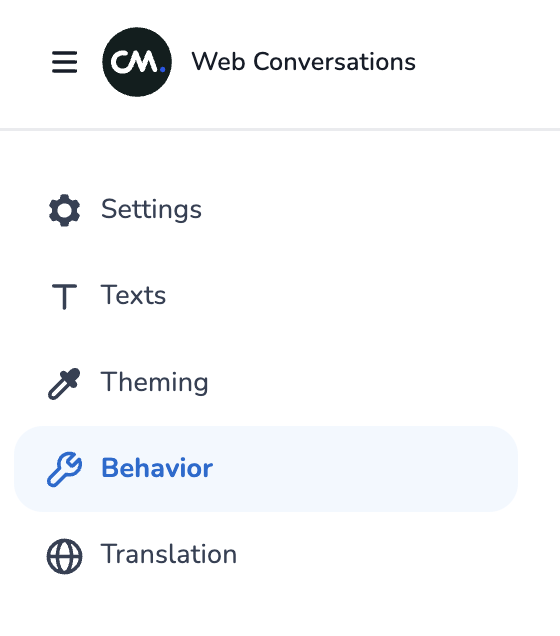
Open the ‘Behavior’ pane in the navigation on the Left side:
-
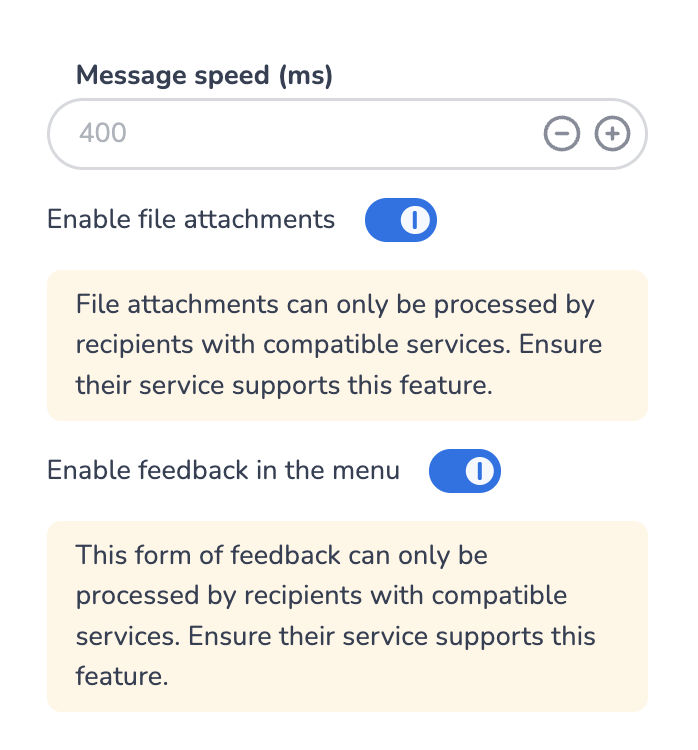
Turn on the ‘Enable feedback in the menu’ setting:
-
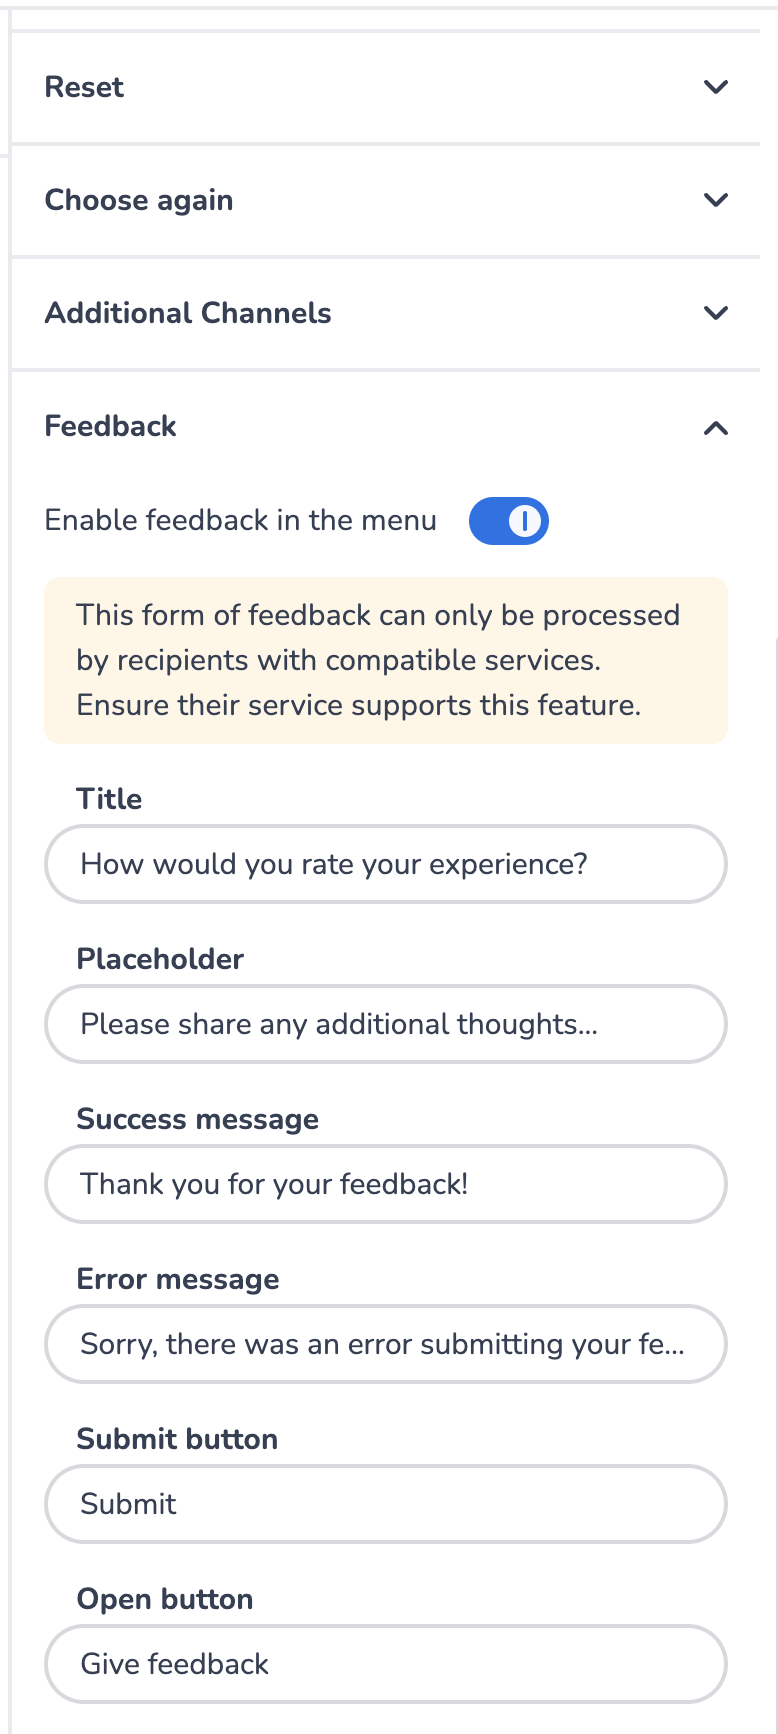
Open the ‘Texts’ pane in the navigation on the Left side, and open the Feedback pane at the bottom right of your Screen, turn on the Feedback and configure the other settings:
-
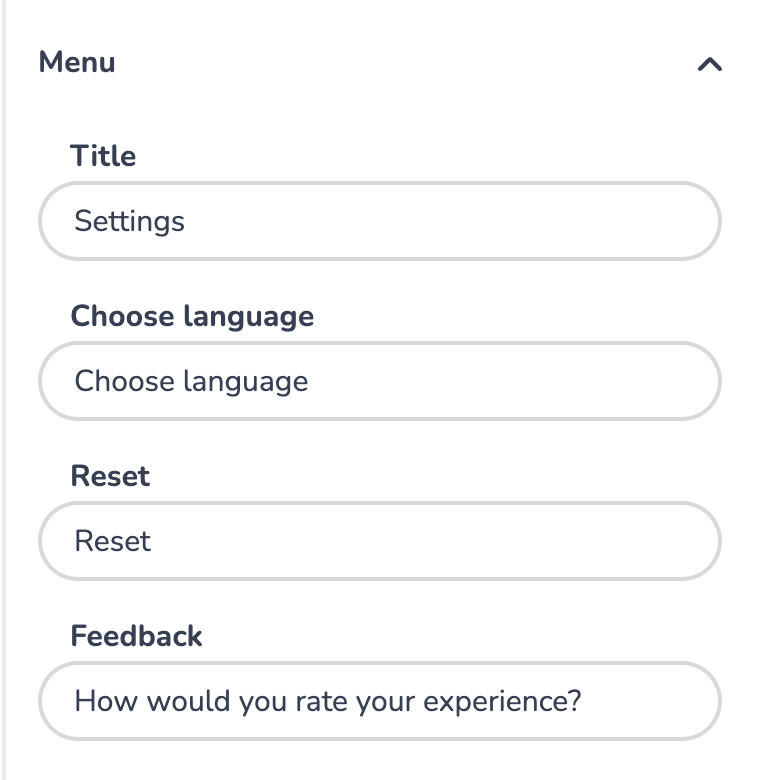
Finally, also within ‘Texts’, open the ‘Menu’ pane on the right to set up the text you want to show in your WebConversations Widget menu:
-
Save your configuration!
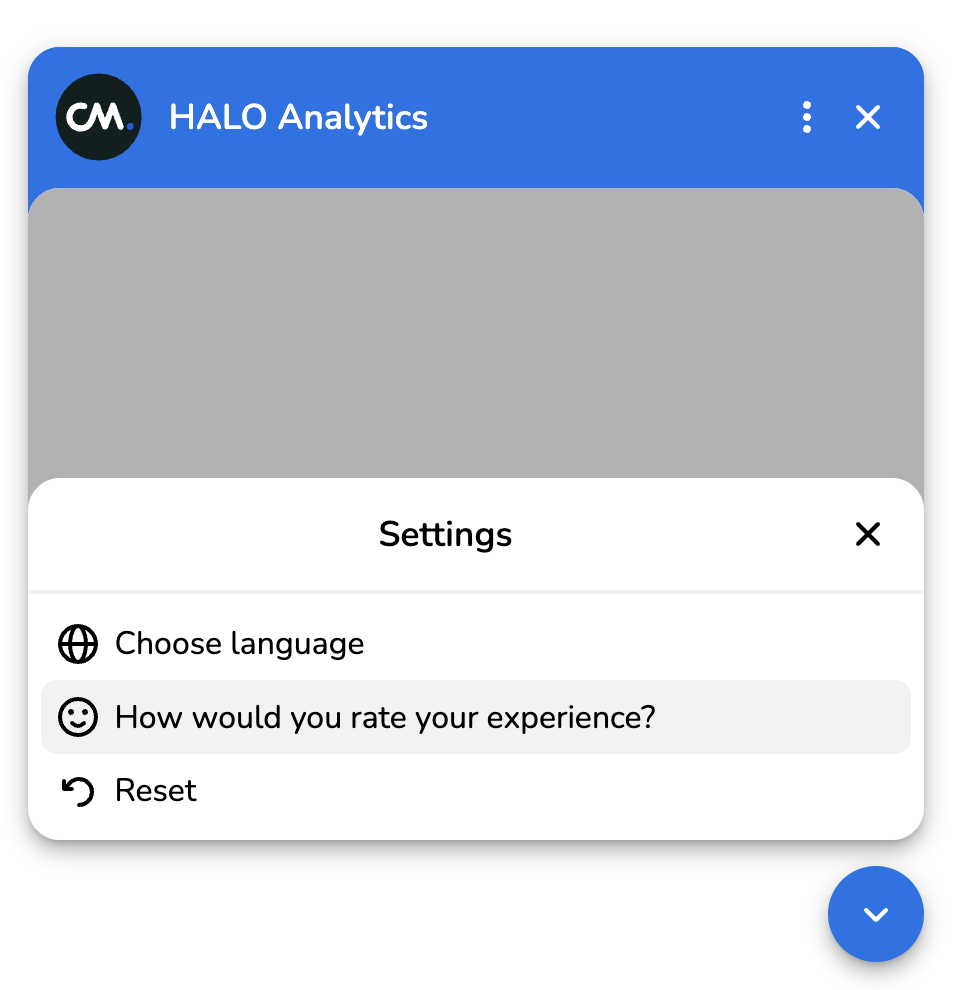
Users are now able to provide Feedback to HALO via the WebConversations widget menu:
Once they click on the Feedback option, the are given the opportunity to provide Feedback in the following way:
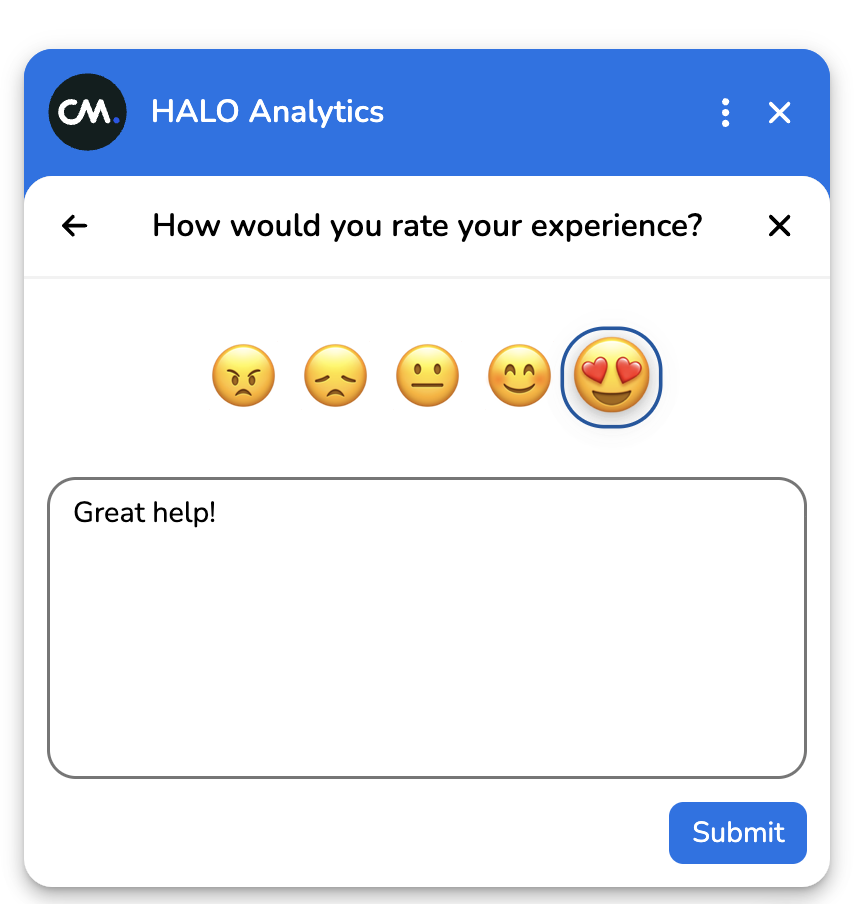
Once submitted, the Feedback will be visible in the HALO Feedback view under the Analytics page!
Next to allowing users to provide Feedback via the WebConversations menu, you can also trigger an interactive Feedback popup from within your HALO Agents. To do this, please check Agent Settings | Enable Feedback Interactions
Learn More with E-Learning Videos
For a detailed walkthrough of configuring feedback in Web Conversations, explore our dedicated e-learning video. This video takes you step-by-step through enabling and customizing the feedback form, including adjusting titles, placeholder text, button labels, menu options, and success messages. It also shows you how to preview and test your configuration to ensure it matches your brand and delivers a seamless user experience.
Currently, the Feedback feature is only automatically supported when using HALO through WebConversations.
If you’re not using WebConversations but can collect user feedback through another system and want that feedback reflected in HALO analytics, this can also be supported through one of our API’s.
Conversation Topic
You can also view which Topics and Subtopics HALO handles in your environment.
HALO automatically analyses conversations and puts them into Topics and Subtopics:
-
Topics
-
Broad categories of user inquiries (e.g., Orders, Account Management)
-
-
Subtopics
-
More granular detail within a Topic (e.g., Order Status, Returns, Cancellations)
-
Every conversation is attempted to be classified into a Topic and Subtopic, though in rare cases no appropriate classification exists and the conversation may remain unclassified.
To allow HALO to create an appropriate Topic and Subtopic tree, at least 500 conversations are required.
Topic Analysis
The Topic Analysis overview combines all Analytics Insights into one visual representation, a so-called Sankey diagram, which shows flows between Topics/Subtopics, resolution statuses, and feedback. The size of the flows between insights represent the relative number of conversations that fall into this category.
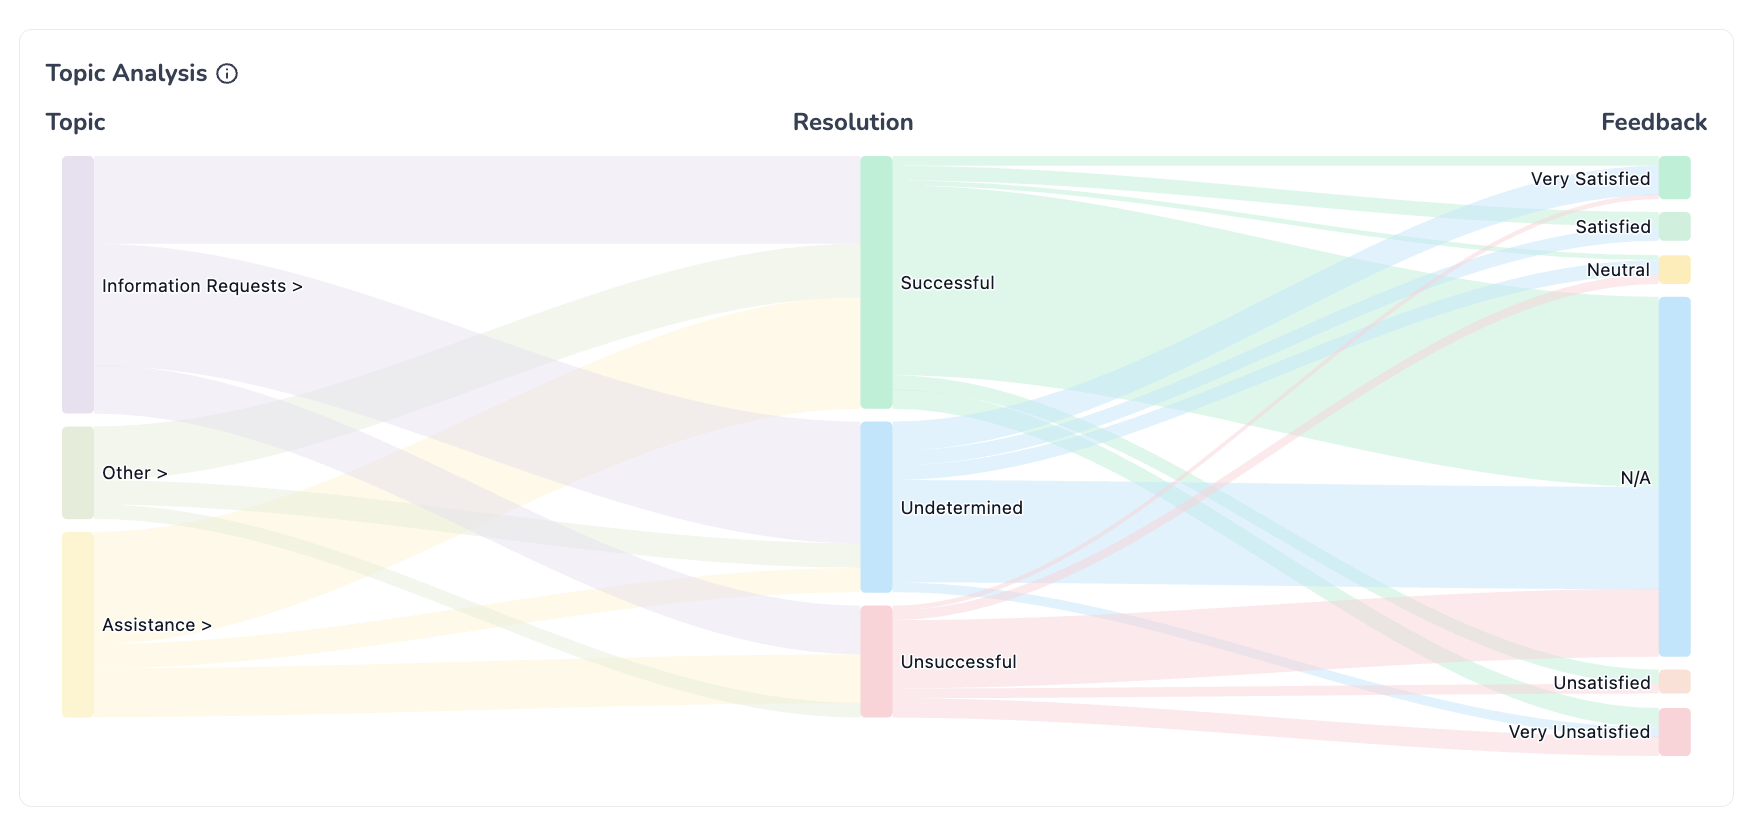
You can click a flow within the diagram to filter the entire Analytics Overview to the selected filters. Clicking on a Topic will ‘zoom in’ the diagram to show the subtopics under that main topic.
You can click on the ‘Optimize’ button at any moment to view the Conversations that fall into the category of the applied filters. For example, if you want to check out conversations with an Unresolved Resolution Status, and within a specific Subtopic, you can apply those filters from the overview, and click on the ‘Optimize’ button.