Description
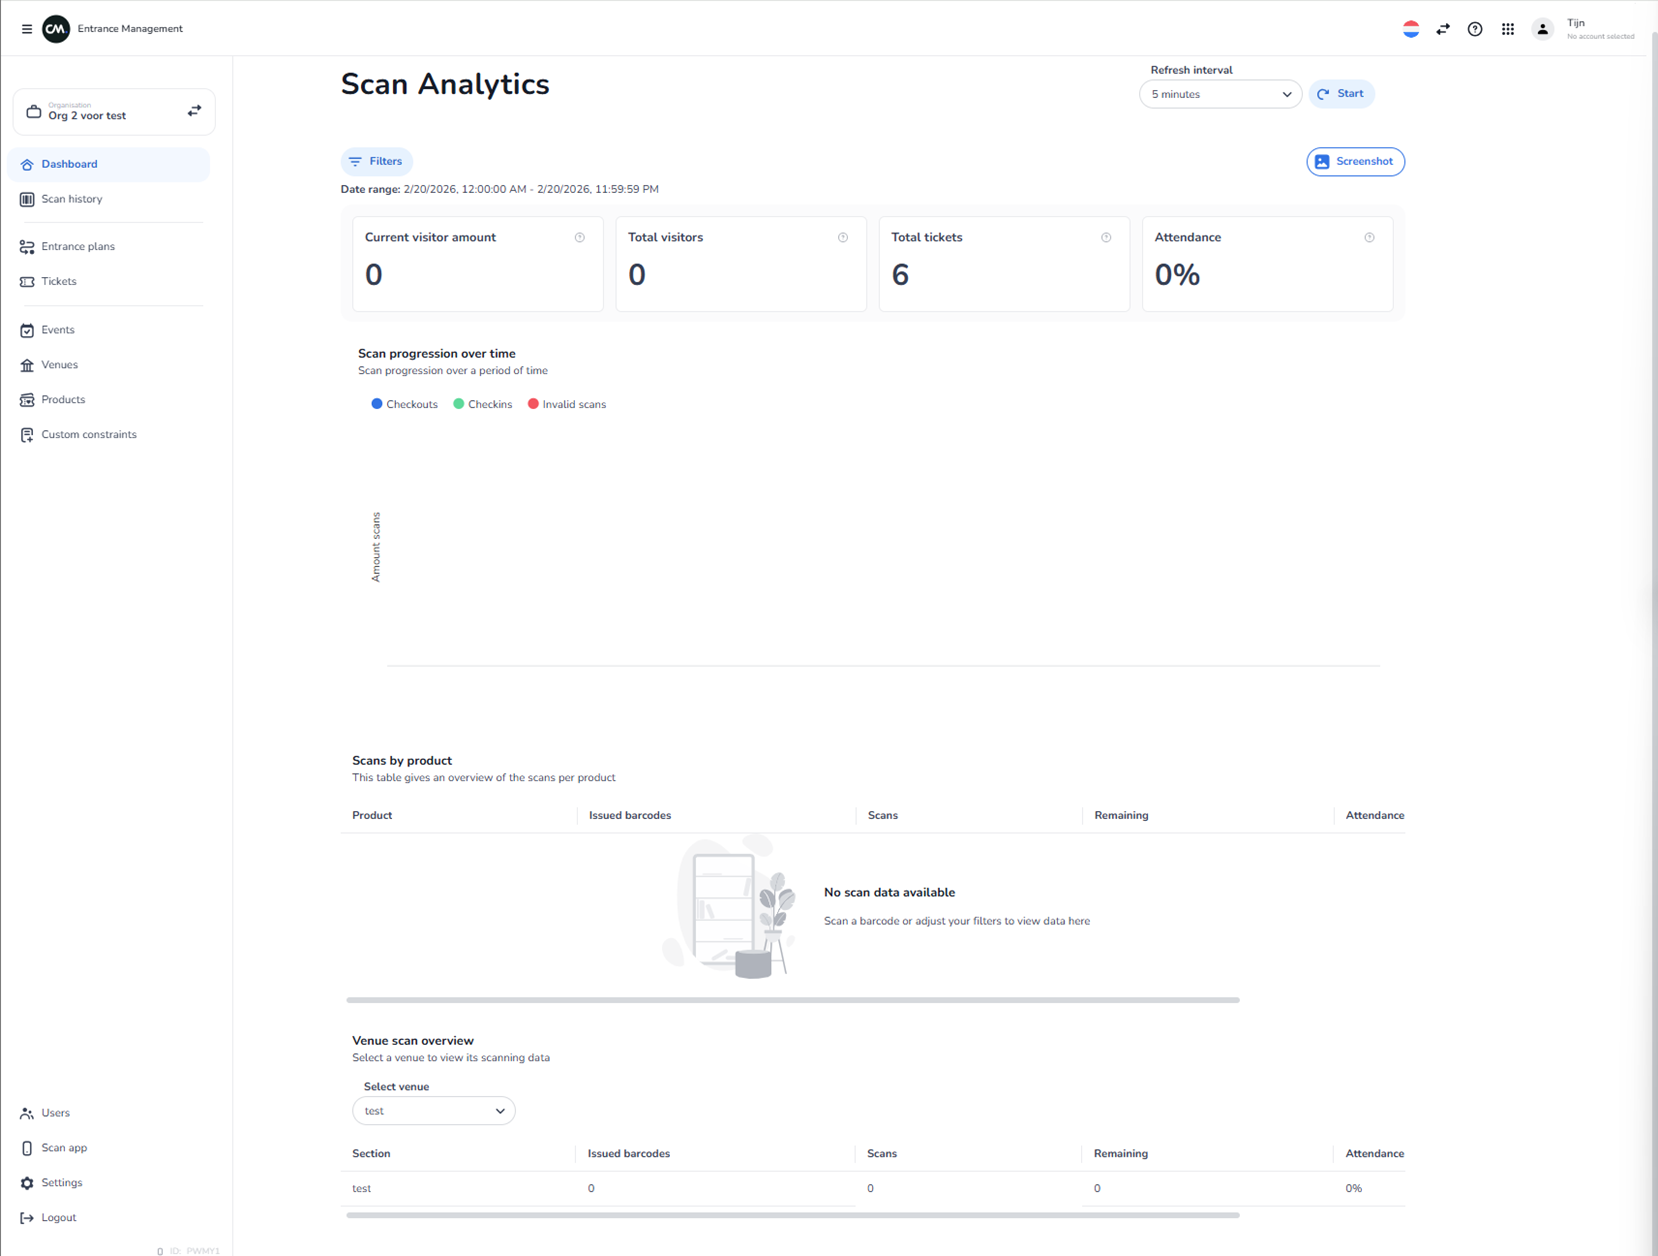
This screen appears after selecting an organisation within the Scanning module. It is the Scan Analytics dashboard of the Entrance Management environment.
The purpose of this page is to provide real-time and historical insights into ticket scanning activity for events within the selected organisation.
From this dashboard, users can:
-
Monitor visitor flow in real time
-
Track check-ins, checkouts, and invalid scans
-
View attendance metrics
-
Analyse scans per product
-
Analyse scans per venue and section
-
Export or capture the current analytics view
All data shown on this screen is dynamic and organisation-specific. The numbers and entries visible in the screenshot are example values and differ per environment.
Top Navigation & Header Area
Entrance Management Header
Located at the top-left corner.
Indicates the user is inside the scanning environment.
Organisation Indicator (Top-left sidebar)
Displays the currently selected organisation.
Function:
-
Shows which organisation’s scan data is active.
-
May allow switching organisation depending on permissions.
User & Account Controls (Top-right)
Includes:
-
Language selector
-
Navigation icons
-
User profile (with account status)
These are global controls and not specific to scanning analytics.
Main Page Header
Title: Scan Analytics
This confirms that the current page provides analytical insights into scanning behaviour.
Filters Section
Filters Button
Located near the top.
Function:
-
Opens filter configuration.
-
Allows narrowing scan data by:
-
Date range
-
Event
-
Venue
-
Product
-
Other scanning criteria
-
Date Range Display
Shows the active date/time range for the analytics view.
Function:
-
Indicates which period the metrics are calculated for.
-
Adjusted via filters.
All metrics and charts are scoped to this selected date range.
Refresh Interval Controls
Located in the top-right area of the analytics section.
Refresh Interval Dropdown
Example shown: 5 minutes
Function:
-
Defines how often the dashboard refreshes automatically.
-
Options typically include multiple time intervals.
Start Button
Function:
-
Activates automatic refreshing of the dashboard.
-
When enabled, the page updates based on the selected refresh interval.
Used for:
-
Real-time monitoring during live events.
Screenshot Button
Function:
-
Captures the current dashboard view.
-
Likely exports or downloads a visual snapshot of the analytics.
-
Useful for reporting or sharing insights.
Key Metrics Overview Cards
These summary cards display high-level scanning metrics.
Current Visitor Amount
Displays:
-
The number of visitors currently inside the venue.
Used for:
-
Real-time occupancy monitoring.
-
Crowd control management.
Total Visitors
Displays:
-
Total number of unique visitors scanned within the selected period.
Total Tickets
Displays:
-
Total number of issued or relevant tickets within the filtered scope.
Attendance
Displays:
-
Percentage of attendance based on tickets vs scans.
-
Calculated metric reflecting turnout rate.
Scan Progression Over Time
Chart Area
Shows a time-based graph of scanning activity.
Legend includes:
-
Checkouts
-
Check-ins
-
Invalid scans
Function:
-
Visualises scan activity trends.
-
Identifies peak entry times.
-
Detects irregular scanning behaviour.
Used for:
-
Operational planning.
-
Performance analysis.
Scans by Product Section
Displays a table summarising scan activity per product.
Columns include:
-
Product
-
Issued barcodes
-
Scans
-
Remaining
-
Attendance
Purpose:
-
Analyse performance per ticket type or product category.
-
Identify high-performing or underperforming products.
If no data is available:
-
A placeholder message appears indicating no scan data for current filters.
Venue Scan Overview
Provides scan breakdown by venue and section.
Select Venue Dropdown
Function:
-
Allows selection of a specific venue.
-
Filters section-level data accordingly.
Section Table
Displays per-section metrics including:
-
Issued barcodes
-
Scans
-
Remaining
-
Attendance percentage
Purpose:
-
Monitor performance per section.
-
Identify bottlenecks or low attendance zones.
-
Support operational decisions on crowd management.
Left Sidebar Navigation
Allows navigation within Entrance Management.
Dashboard
-
Current page (Scan Analytics).
Scan History
-
View detailed log of individual scan actions.
Entrance Plans
-
Configure entry logic and access rules.
Tickets
-
Manage ticket configurations related to scanning.
Events
-
View events configured for scanning.
Venues
-
Manage venue-specific scanning setup.
Products
-
View or configure ticket products.
Custom Constraints
-
Define validation rules or restrictions.
Bottom Sidebar Controls
Users
-
Manage scanning environment users.
Scan App
-
Access or configure scanning application settings.
Settings
-
Configure scanning-related settings.
Logout
-
Exit Entrance Management.
What This Page Does
This page functions as the central operational analytics dashboard for scanning activity.
It enables:
-
Real-time event monitoring
-
Attendance analysis
-
Product performance tracking
-
Venue-level insight
-
Operational decision support
It is primarily used by:
-
Event operations teams
-
Security and access control managers
-
Event organisers
-
Venue managers
What You Can Do With It
On this screen, a user can:
-
Adjust filters to analyse specific periods or events
-
Enable automatic refresh for live monitoring
-
Capture screenshots for reporting
-
View total attendance metrics
-
Monitor real-time visitor counts
-
Analyse scanning patterns
-
Drill down into venue and section-level data
This dashboard supports both live event management and post-event reporting.