Description
Detailed filter options to find specific sessions/journeys and a drillthrough from the main pivot to see exactly what happened in a single session. Data is available over a fairly short time period (14 days – twice as long as the data is available in the equivalent existing dashboard)
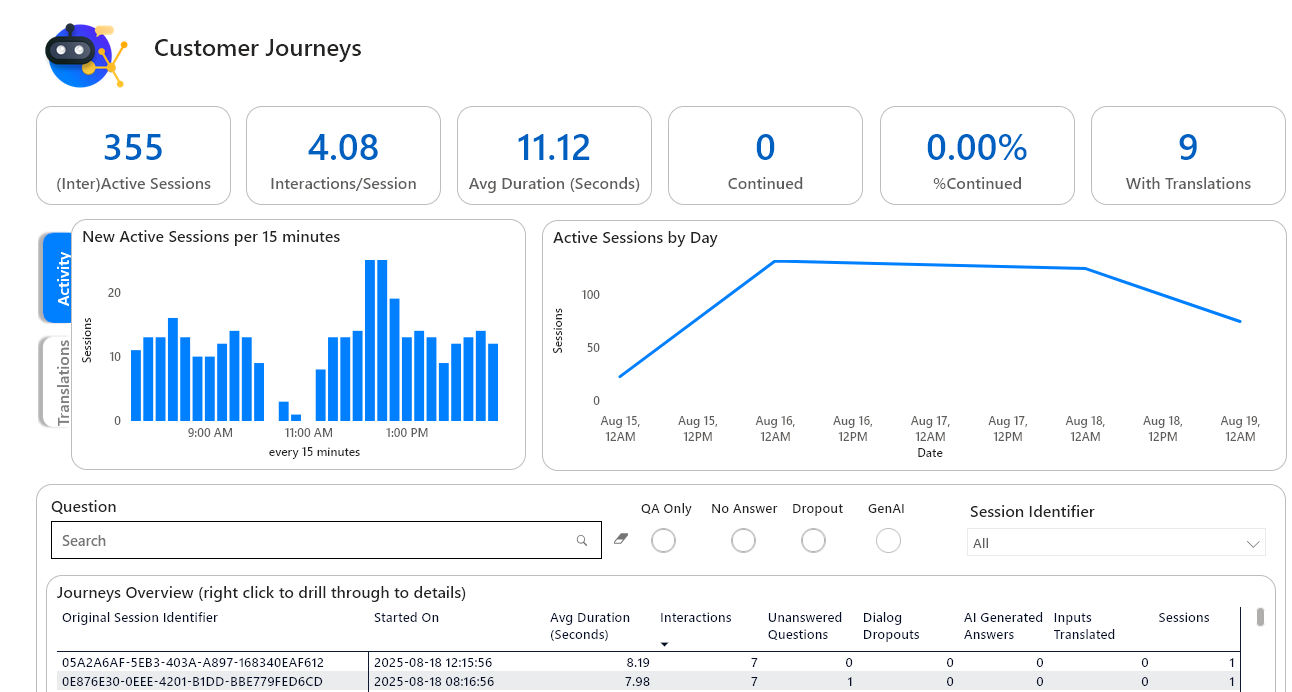
KPIS in the top row include information about features that are not available in other dashboards such as continued sessions (sessions which had interactions after expiring) and sessions with were translations
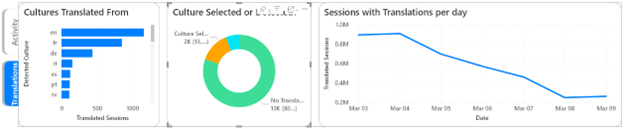
The charts in the center by default show the number of sessions per 15 minutes, and the number of sessions per day, but a tab on the left side allows switching to information about which cultures was translated from, whether the translation was based on detection or selection, and how many sessions had translations each day.
The filter bar on the right has filters that apply to the entire dashboard, but the lower block of charts has its own separate filters that only apply to the widgets within the border. This includes a free text filter to search sessions where certain words appeared in the question/interactionvalue, and whether those interactions were QA only, didn’t receive an Answer, dropped out of a Dialog, or were answered by Generative AI.
From the overview table there is a drillthrough to see all the interactions in the entire session together with details about each interaction. The overview links continued sessions to one another via the original sessionuuid, so drilling through can show multiple sessions that are linked to one another. The sessionuuid filter can be used to find specific sessions.
Slicers Specific to this dashboard:
This dashboard lacks the Session Mode and Session Activity filters because it only shows Public and Active sessions. The ‘Time Period’ filter is also much reduced because this dashboard has data over a much shorter time so periods of ‘Last Month’ would be useless.
In addition to the standard Slicers, this dashboard can also be filtered on Translation, to only see sessions where some interactions were translated because of a Detected Culture, a Selected Culture, or sessions where there was either No Detection or No Translations at all.
You can also filter the dashboard on the Detected (Translated) Culture, the Dialog Name, the Event name, and to show sessions that received Positive or Negative feedback.
In all cases, including the standard filters, this dashboard is filtered to show the Sessions the filter applies to instead of the specific Interaction.
Metrics & Measures:
(Inter)Active Sessions:
Number of Active Sessions. See Landing page
Interactions/Session
Average number of interactions per session
Continued
The number of sessions that have been continued, meaning an interaction came in with an expired sessionuuid. This starts a new session that we can link to the old one.
%Continued
The number of sessions that have been continued, as a percentage of all sessions.
With translations/Translated Sessions/Sessions with Translation
Number of sessions where at least 1 interaction was translated.
New Active Sessions
The number of Active sessions started in a given timeframe.
Interactions
Number of interactions (in the collection of sessions, in this case)
Sessions
All the sessions united under the Original Session Identifier; if this is greater than 1 there were continuations.
Unanswered Questions
User Questions that did not receive any answer.
Dialog Dropouts
User questions that dropped out of a Dialog
AI Generated Answers
User questions that were answered via GenerativeAI/HALO
Inputs Translated
User questions that were translated to the culture of the project from a different culture
Dialog Completion
Number of distinct Dialogs Ended divided by number of Dialogs started. This is calculated over the continued sessions so this may be a slightly different number from the similar KPI reported on MR/Landingpage.
Positive Feedback
The number of interactions receiving positive feedback divided by the total number of interactions receiving feedback.
Recognition Rate
The number of Q&A interactions receiving an Answer divided by the total number of Q&A interactions
Recognition Quality
The total Recognition Quality of Q&A interactions that weren’t answered using Intents or GenerativeAI, divided by the total number of these Q&A interactions.
E-learning Video:
Notes
Equivalent to the deprecated CustomerJourneys dashboard.
Differences:
-
14 days of data; increased from 7
-
Avg session duration is calculated differently so gives a different number.I
-
% translated is no longer a KPI
-
Filter on Dialog Dropout gives Q&A questions that dropped out of a Dialog instead of sessions where a dialog was left unfinished.
-
No more ‘exact match’ in the Question filter