Overview
This knowledge agent provides guidance about the Finance view inside the event dashboard of the NXT Gen ticketing platform.
When a user creates or selects an event, they are taken to the event dashboard, where various statistics and reports about the event can be viewed.
At the top of the dashboard there are multiple tabs such as:
-
Ticket sales
-
Finance
-
Realtime sales
-
Sharing center
This article describes the Finance tab.
The Finance view focuses specifically on the financial overview of the event, including revenue, discounts, refunds, and platform costs.
How to Access the Finance Dashboard
To view financial statistics:
-
Open the ticketing platform.
-
Select or create an event.
-
You will arrive at the event dashboard.
-
At the top of the dashboard, click Finance.
This opens the financial overview for the selected event.
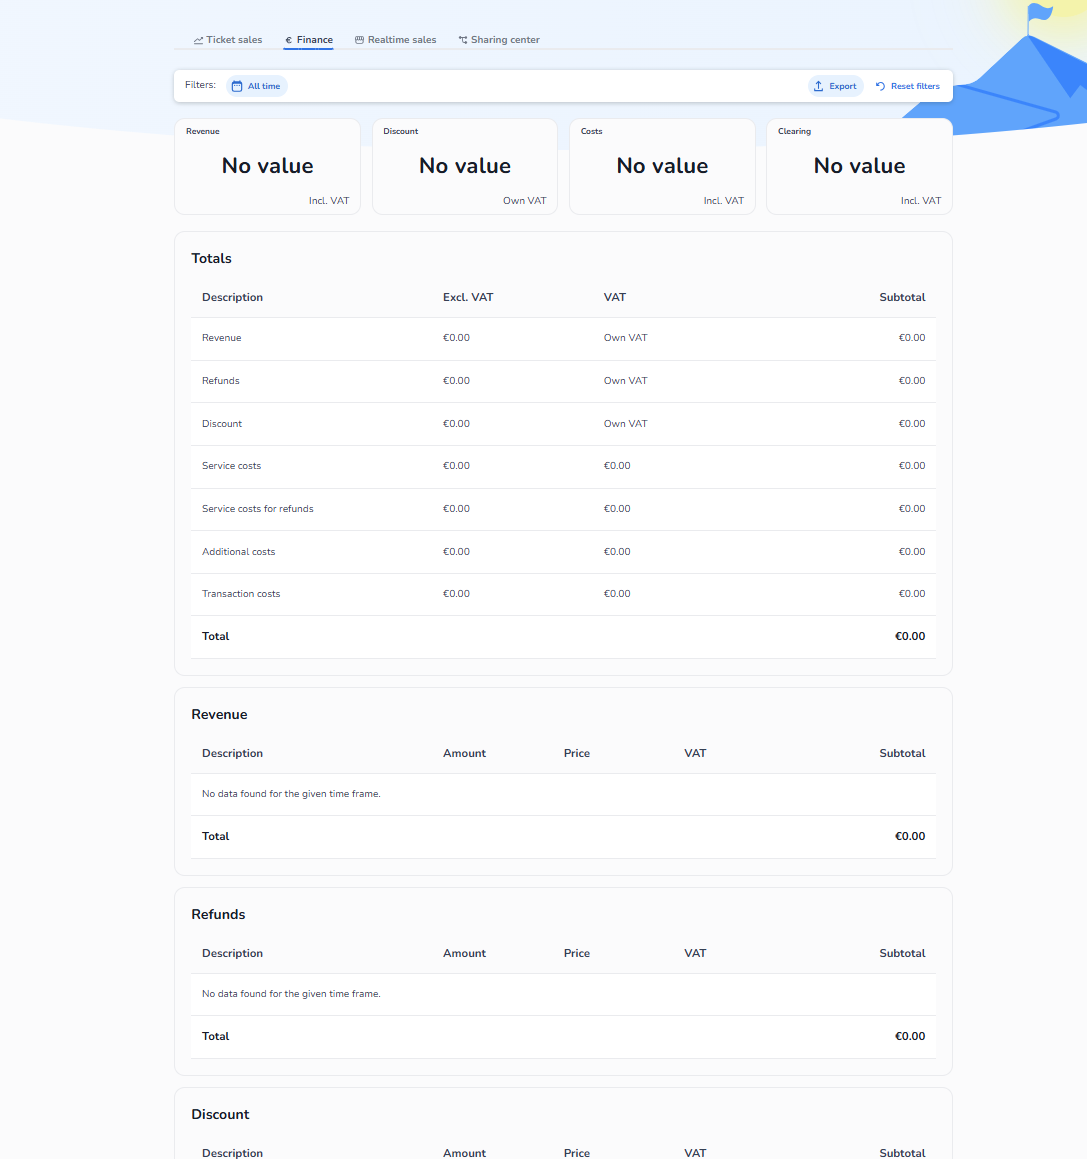
What You See in the Finance Dashboard
The Finance dashboard provides a structured overview of the financial flow of the event.
At the top of the page you will see summary statistics such as:
-
Revenue
-
Discount
-
Costs
-
Clearing
These values summarize the financial activity within the selected timeframe.
Filters can be applied to change the timeframe (for example All time or a specific period).
Users can also export the financial data using the export button.
Totals Section
The Totals section provides a summary of the most important financial components of the event.
This includes:
-
Revenue
Total income generated from ticket sales. -
Refunds
The amount refunded to customers. -
Discount
Discounts applied through promotional campaigns. -
Service costs
Platform service fees applied to ticket sales. -
Service costs for refunds
Costs associated with refunded transactions. -
Additional costs
Extra costs configured within the platform. -
Transaction costs
Payment processing costs.
Each item displays:
-
amount excluding VAT
-
VAT value
-
subtotal
At the bottom, the total financial balance is displayed.
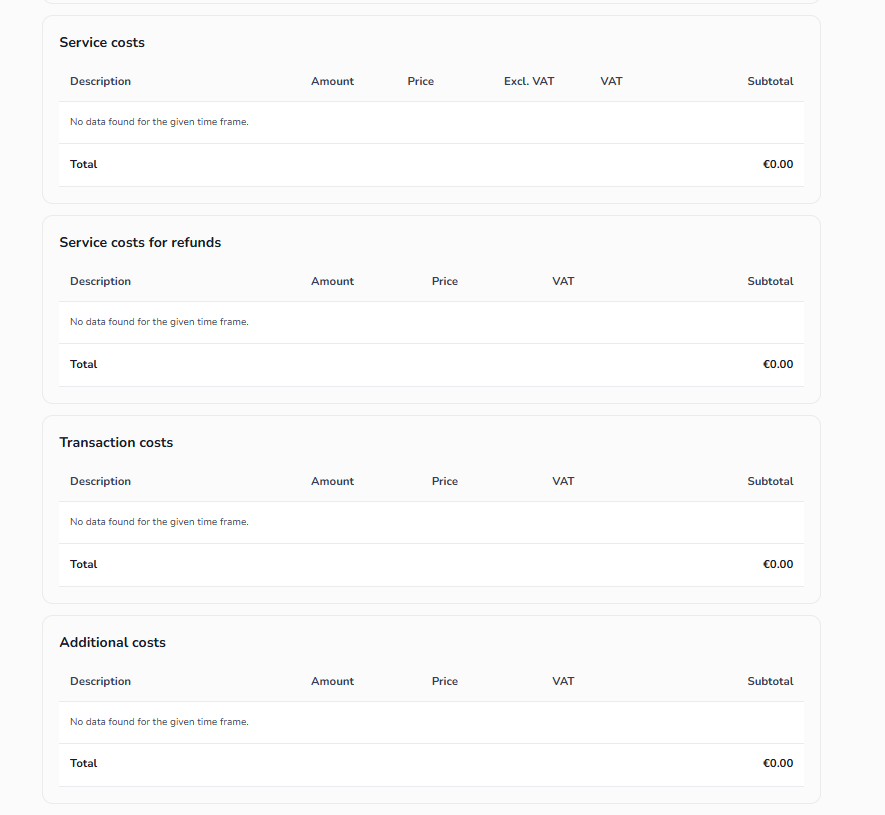
Detailed Financial Sections
Below the totals overview, the dashboard shows detailed breakdowns for different financial categories.
Revenue
This section shows:
-
sold ticket quantities
-
ticket prices
-
VAT applied
-
subtotal values
This helps users understand how ticket sales generate revenue.
Refunds
Displays all refund-related transactions, including:
-
refunded ticket amounts
-
refund values
-
VAT information
Discounts
Shows discounts applied through discount campaigns or other promotional configurations.
Service Costs
Displays the platform service fees applied to ticket sales.
Service Costs for Refunds
Shows service costs that apply when transactions are refunded.
Transaction Costs
Displays payment processing costs from payment providers.
Additional Costs
Shows any additional costs configured within the platform.
Important Notes
Financial values depend on the selected time filter.
If no transactions exist in the selected timeframe, the dashboard will show:
“No data found for the given time frame.”
The Finance dashboard is used for financial analysis and reconciliation, helping event organizers understand how revenue, refunds, discounts, and costs impact the final financial result of the event.
If you want, I can also write the Realtime Sales dashboard agent description (which is the next tab next to Finance). That one is important because agents often confuse Realtime sales vs Ticket sales analytics.