Description
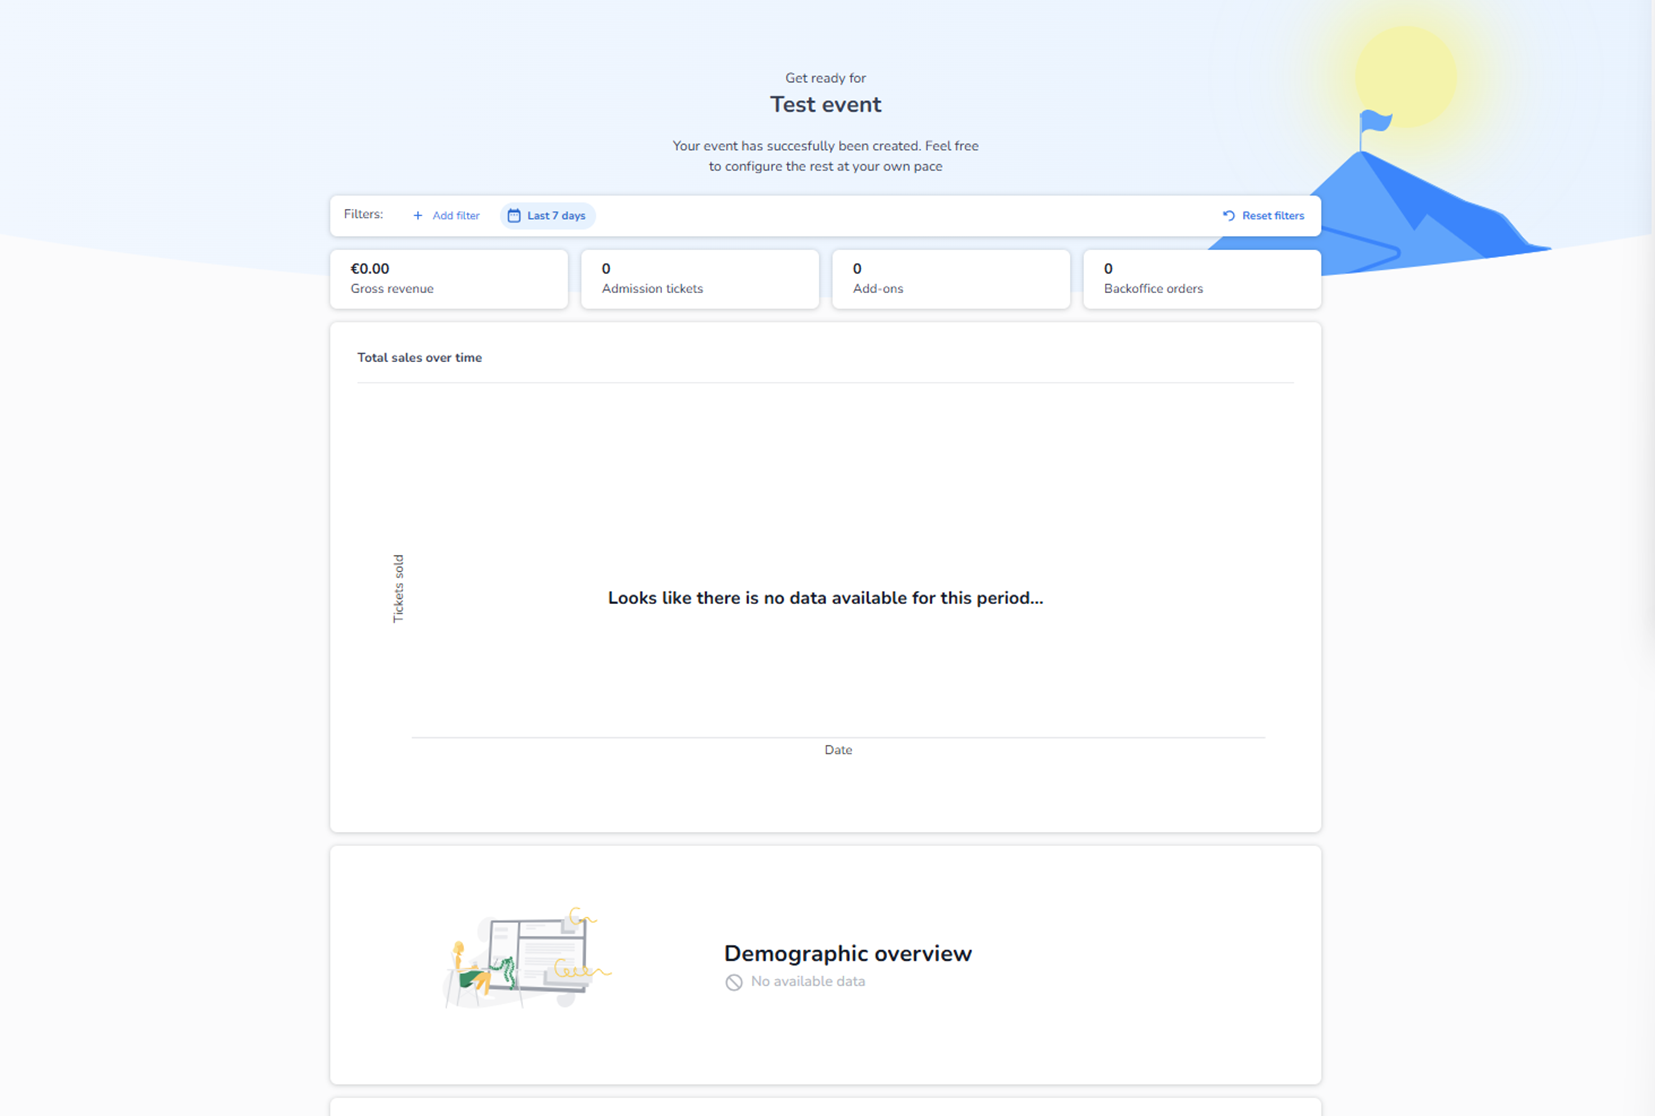
Inside the Dashboard section of a selected event, you see a complete analytical overview of your event customers and buyers.
This page provides real-time insights into sales performance, purchasing behavior, demographics, and geographic origin of your audience.
If no tickets have been sold yet, the modules will show “no data available.” Once sales start, all widgets populate automatically.
What You See on the Dashboard
-
KPI Summary Tiles (Top Overview)
At the top of the dashboard, you see key performance indicators:
-
Gross revenue
-
Admission tickets sold
-
Add-ons sold
-
Backoffice orders
These tiles give you a quick snapshot of your event’s financial and sales status.
You can also filter the data by time period (for example, last 7 days) or apply custom filters.
-
Total Sales Over Time
This section shows:
-
A timeline graph of ticket sales
-
Sales progression by date
-
Growth patterns during the selected period
This helps you analyze:
-
Sales peaks
-
Campaign impact
-
Sales momentum
-
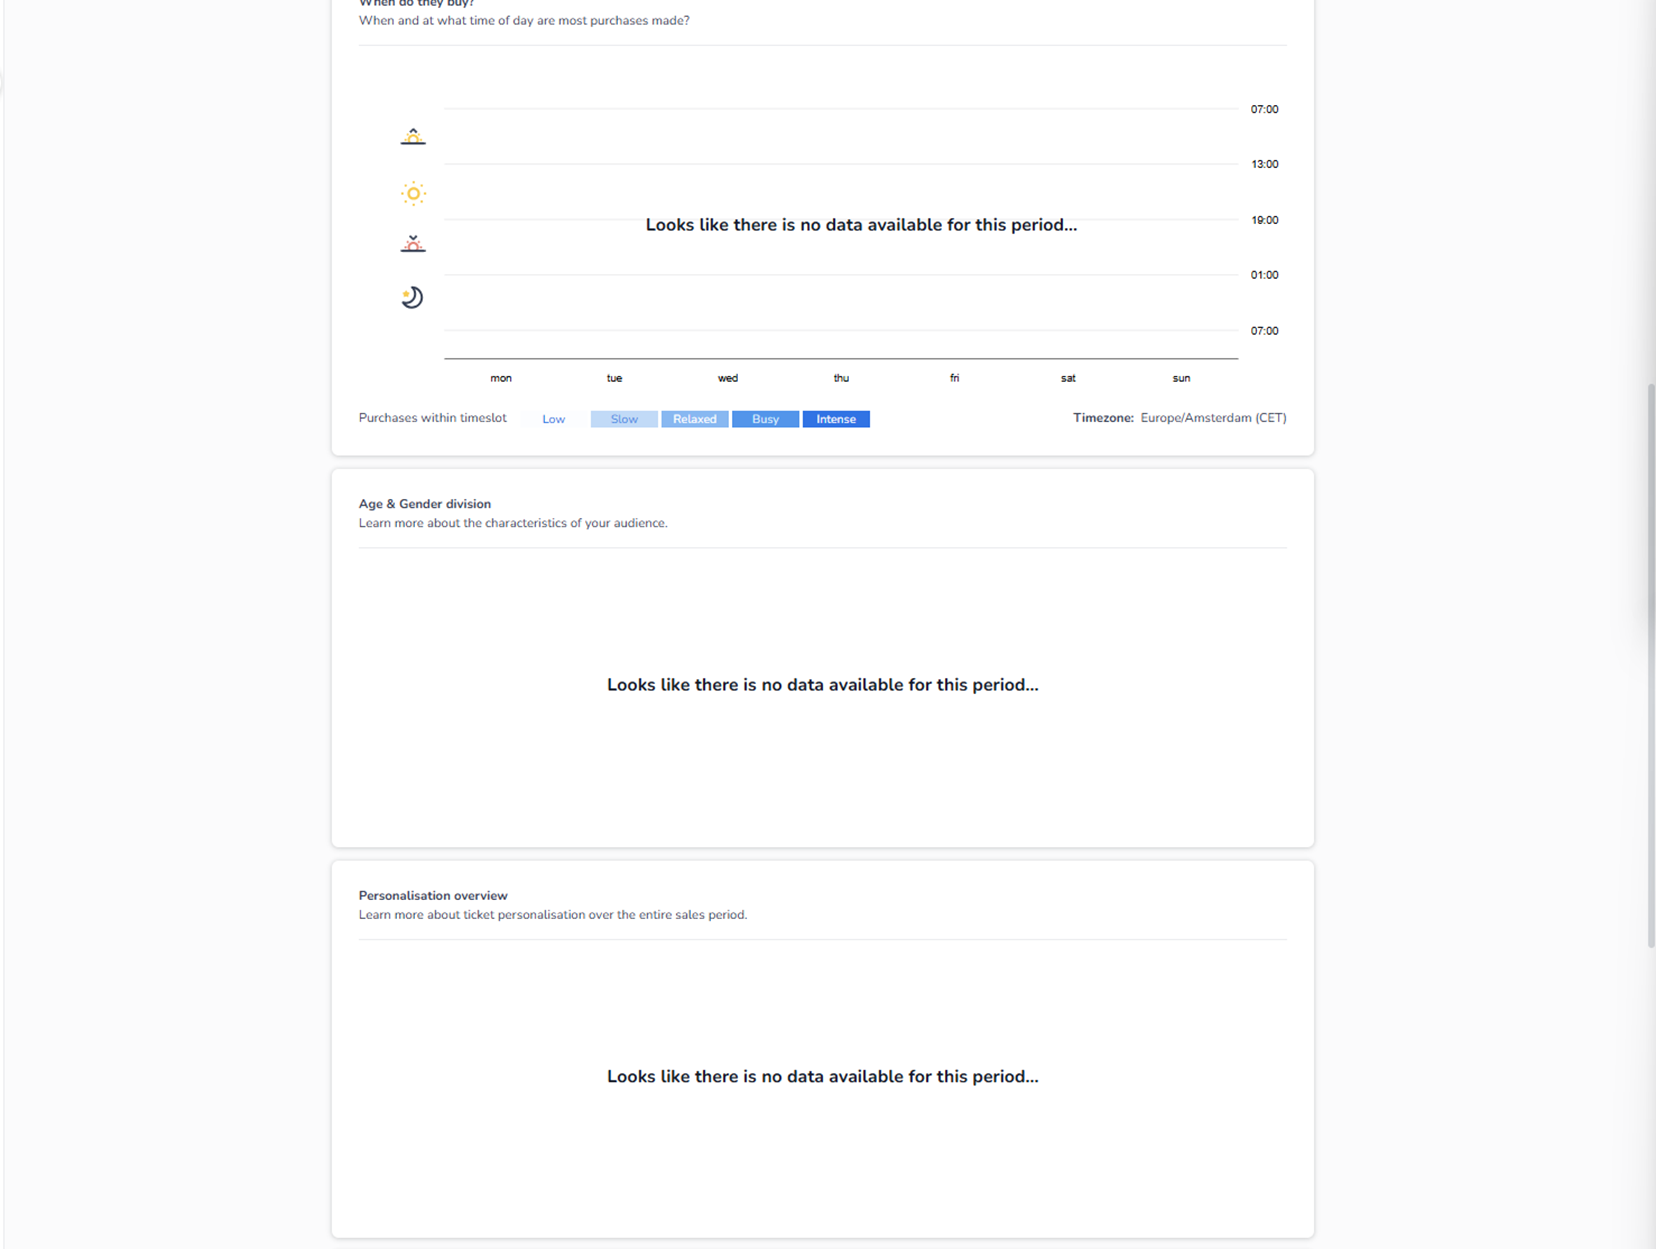
When Do They Buy?
This module shows:
-
What day of the week purchases happen
-
What time of day customers buy tickets
-
Purchase intensity levels (low → intense)
It helps you understand:
-
Buyer behavior
-
Optimal promotion timing
-
Peak conversion windows
Timezone is clearly displayed to ensure accuracy.
-
Age & Gender Division
This section shows:
-
Age group distribution
-
Gender breakdown
It provides insight into:
-
Audience composition
-
Target group validation
-
Marketing optimization
-
Personalisation Overview
This module shows:
-
Ticket personalisation data
-
Completion status across the sales period
Useful for:
-
Identifying missing attendee information
-
Understanding personalisation trends
-
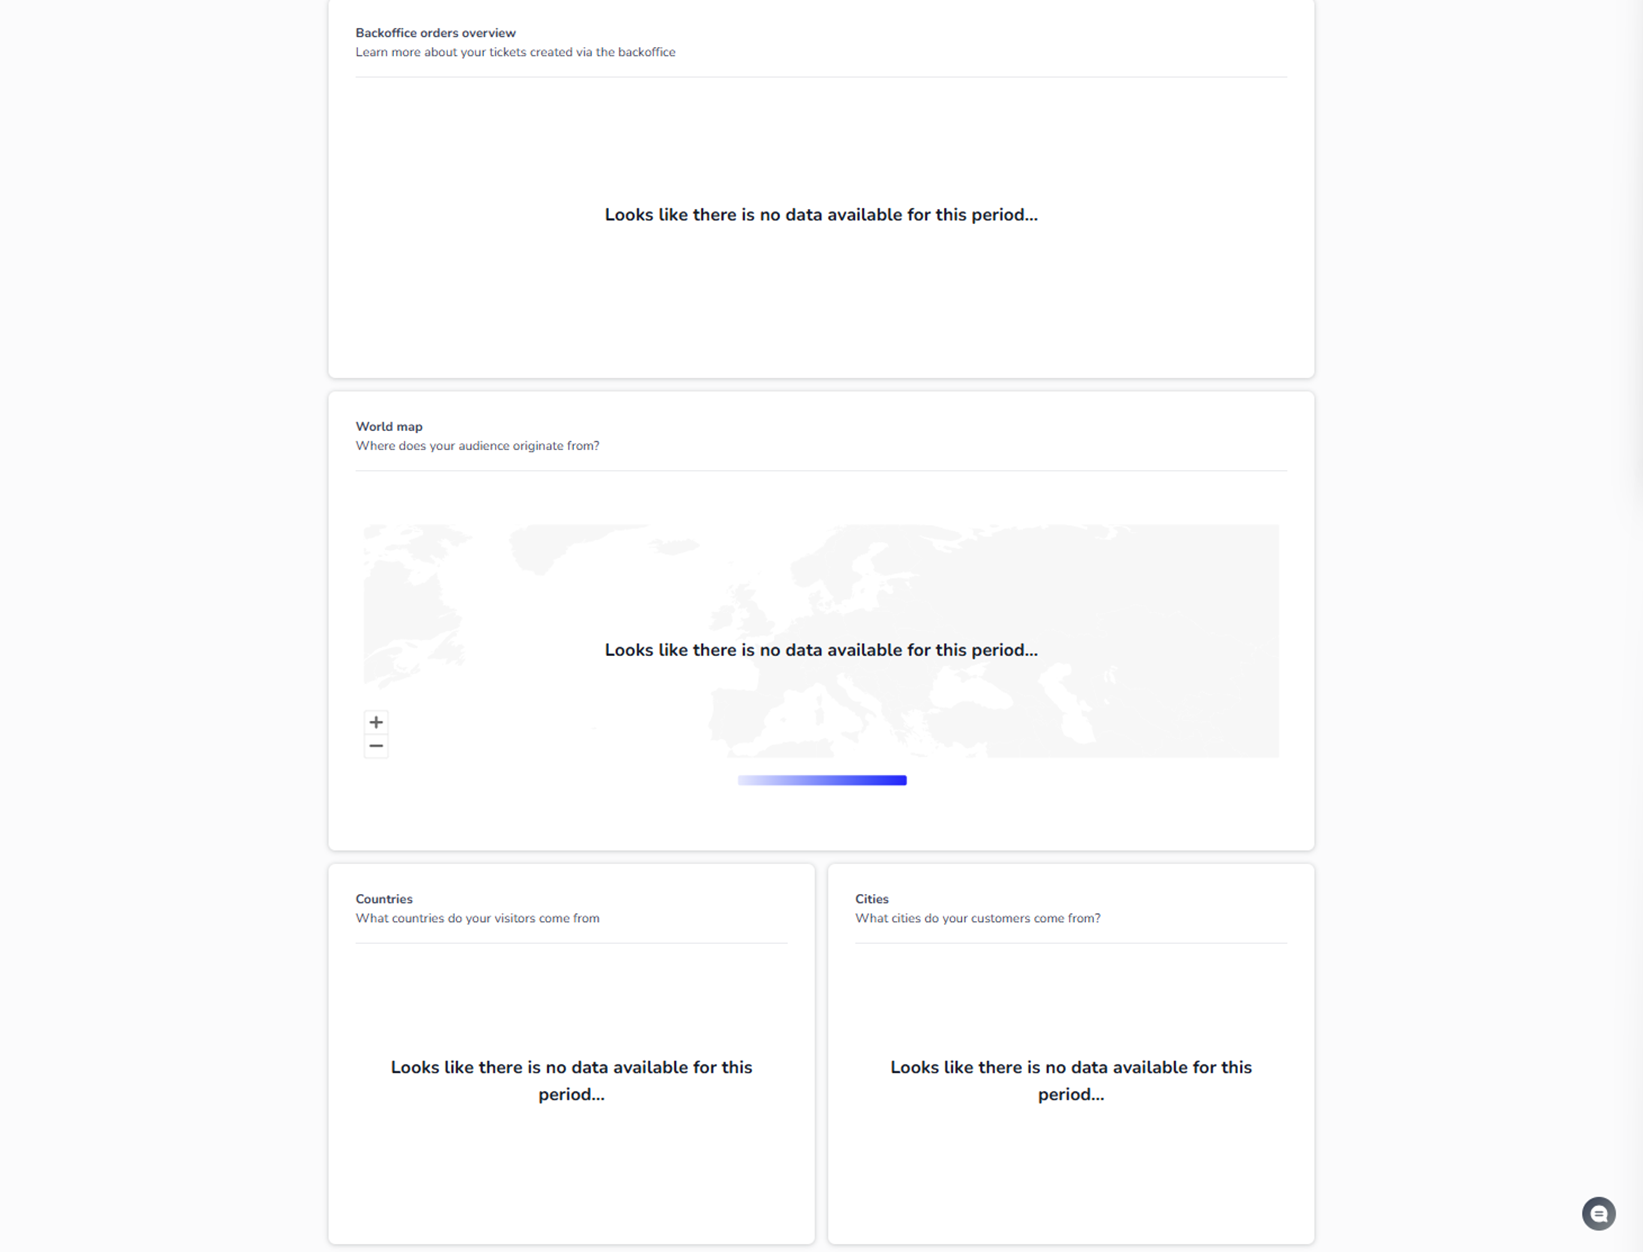
Backoffice Orders Overview
This section highlights:
-
Tickets created manually via backoffice
-
Internal order activity
This helps separate:
-
Online sales
-
Internal / manual ticket creation
-
Geographic Insights – World Map
The map visualizes:
-
Where your audience originates from
-
Geographic concentration of buyers
It gives a visual representation of customer distribution across countries.
-
Countries & Cities Breakdown
Below the map, you see:
-
Countries overview
-
Cities overview
These modules show:
-
Which countries generate the most buyers
-
Which cities contribute most to sales
Useful for:
-
Regional marketing insights
-
Expansion analysis
-
Audience targeting
Important Context
If your event is new:
-
No revenue is shown
-
No demographic data exists
-
No geographic data appears
-
Graphs remain empty
Once tickets are sold and orders are placed, this dashboard becomes your main performance intelligence center.
Purpose of the Dashboard
The Dashboard is designed to:
-
Monitor event performance
-
Understand buyer behavior
-
Analyze audience characteristics
-
Support marketing decisions
-
Track financial results
It is the analytical command center of your event.