Description
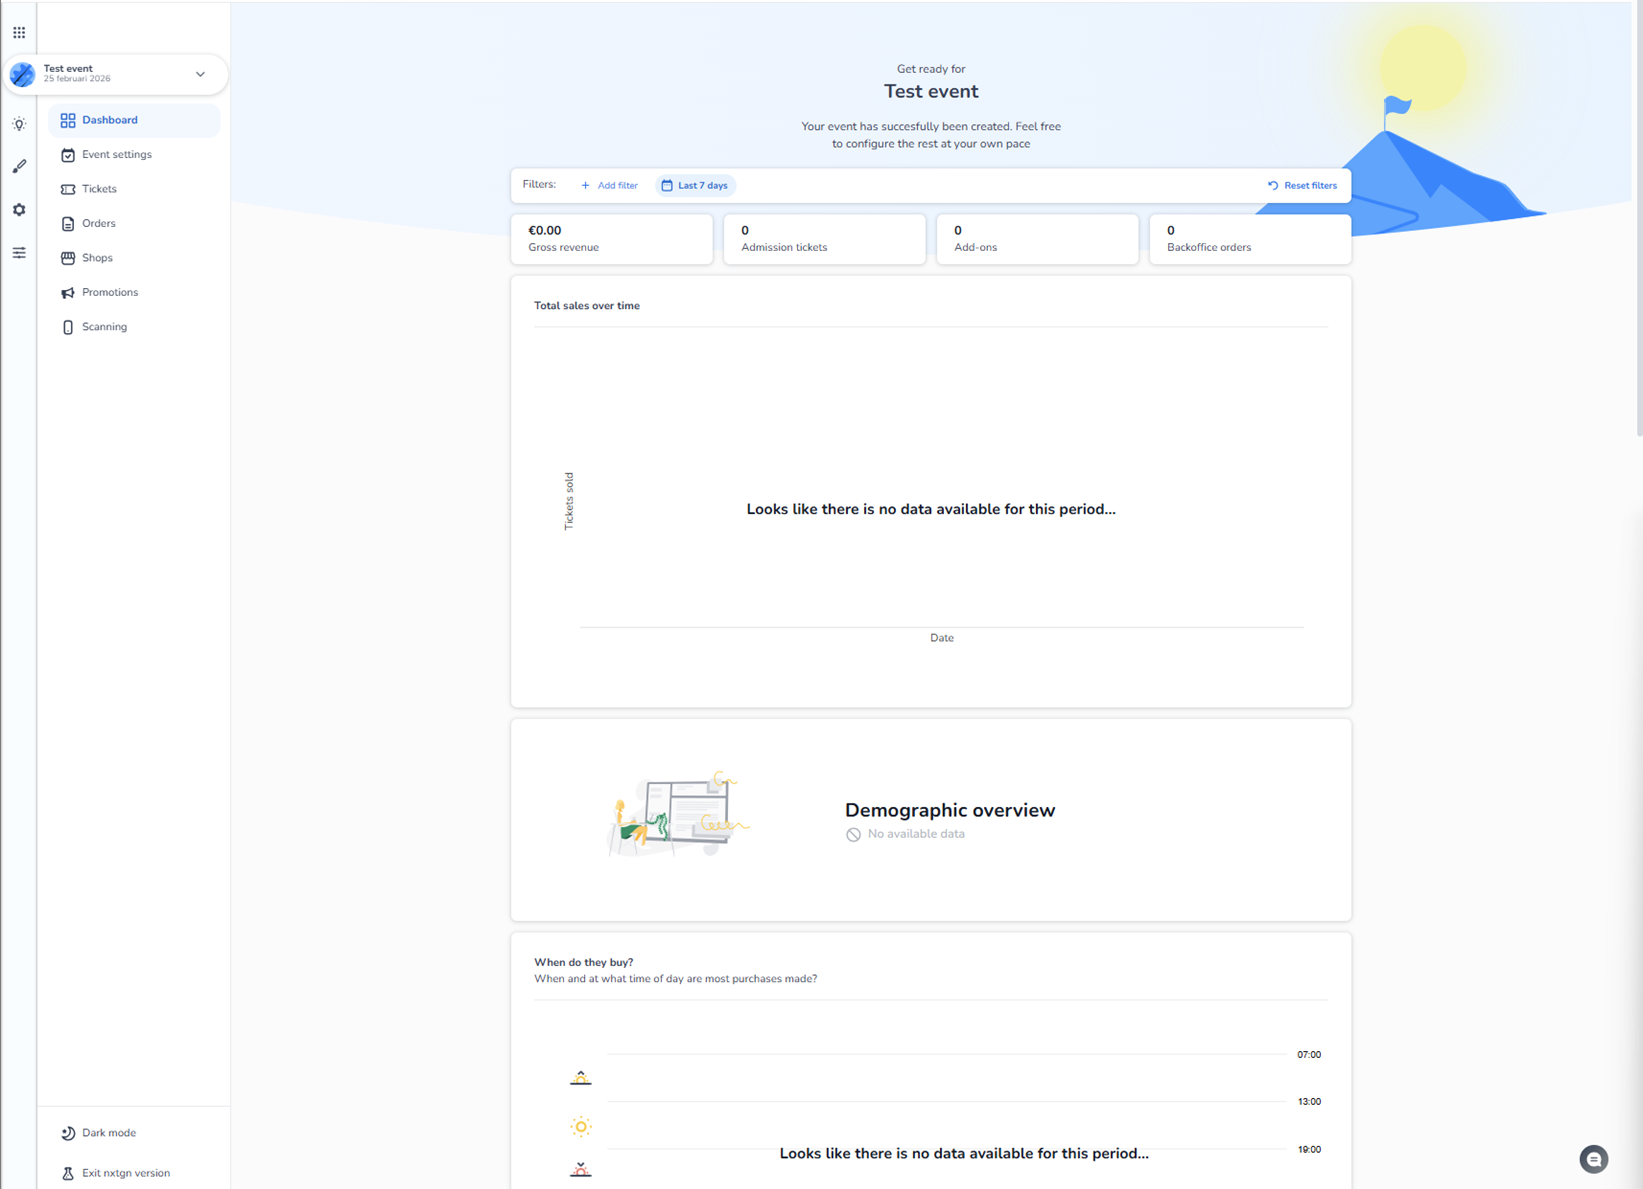
When you select or create an event, you are taken to the Event Dashboard.
This is the central overview page for the selected event.
It gives you insight into performance, sales, and visitor data once the event is active and transactions have started.
If the event is newly created, no data will be visible yet.
Left Sidebar Navigation (Event-Level Navigation)
On the far left, you see the event-specific navigation menu.
At the very top, the selected event name is shown. Below that, the main sections are available:
-
Dashboard (Insight overview)
-
Event settings
-
Tickets
-
Orders
-
Shops
-
Promotions
-
Scanning
These sections allow you to configure and manage all operational aspects of the selected event.
Top Icon Navigation (Platform Areas)
In the upper area of the screen, you also see platform-level icons:
-
Grid icon → Events / Insight
-
Pencil icon → Design
-
Gear icon → Settings
-
Sliders icon → Internal
These icons switch between broader platform domains:
-
Insight (event performance & analytics)
-
Design (visual configuration)
-
Settings (configuration & permissions)
-
Internal (organisation-level management)
The current screen is within the Insight / Dashboard area.
What You See on the Dashboard
The dashboard shows performance widgets and analytics modules, such as:
KPI Tiles
-
Gross revenue
-
Admission tickets sold
-
Add-ons
-
Backoffice orders
Sales Over Time
A graph displaying ticket sales across a selected time range.
Demographic Overview
Audience data and segmentation (if available).
Purchase Timing Insights
Information about when customers buy tickets.
Why No Data Is Visible
If the event is new or not yet live:
-
No tickets have been sold.
-
No orders exist.
-
No scans have occurred.
Therefore:
-
Revenue shows zero.
-
Graphs are empty.
-
Analytics modules display “no data available.”
Once the event starts generating activity, the dashboard automatically updates with real-time data.
Purpose of the Dashboard
The dashboard is meant to:
-
Monitor sales performance
-
Track revenue
-
Analyze buyer behavior
-
Review demographic insights
-
Evaluate event success
It acts as the operational insight center for the selected event.